Minitab is a statistical software package widely used in Lean Six Sigma projects. You use it to make graphs, analyse your measurement system, calculate how well a process performs and test whether a cause really has an effect. You work with it in our Black Belt and Green Belt to Black Belt courses.
Where does Minitab come from?
Minitab was developed in 1972 at Pennsylvania State University by Barbara F. Ryan, Thomas A. Ryan Jr. and Brian L. Joiner. It was intended to teach students statistics without first having to program, and started as a light version of OMNITAB, a statistics program from the US National Bureau of Standards (now NIST). Today Minitab is a commercial package, for desktop and browser, and one of the best-known programs in the Six Sigma world.
What do you do with Minitab?
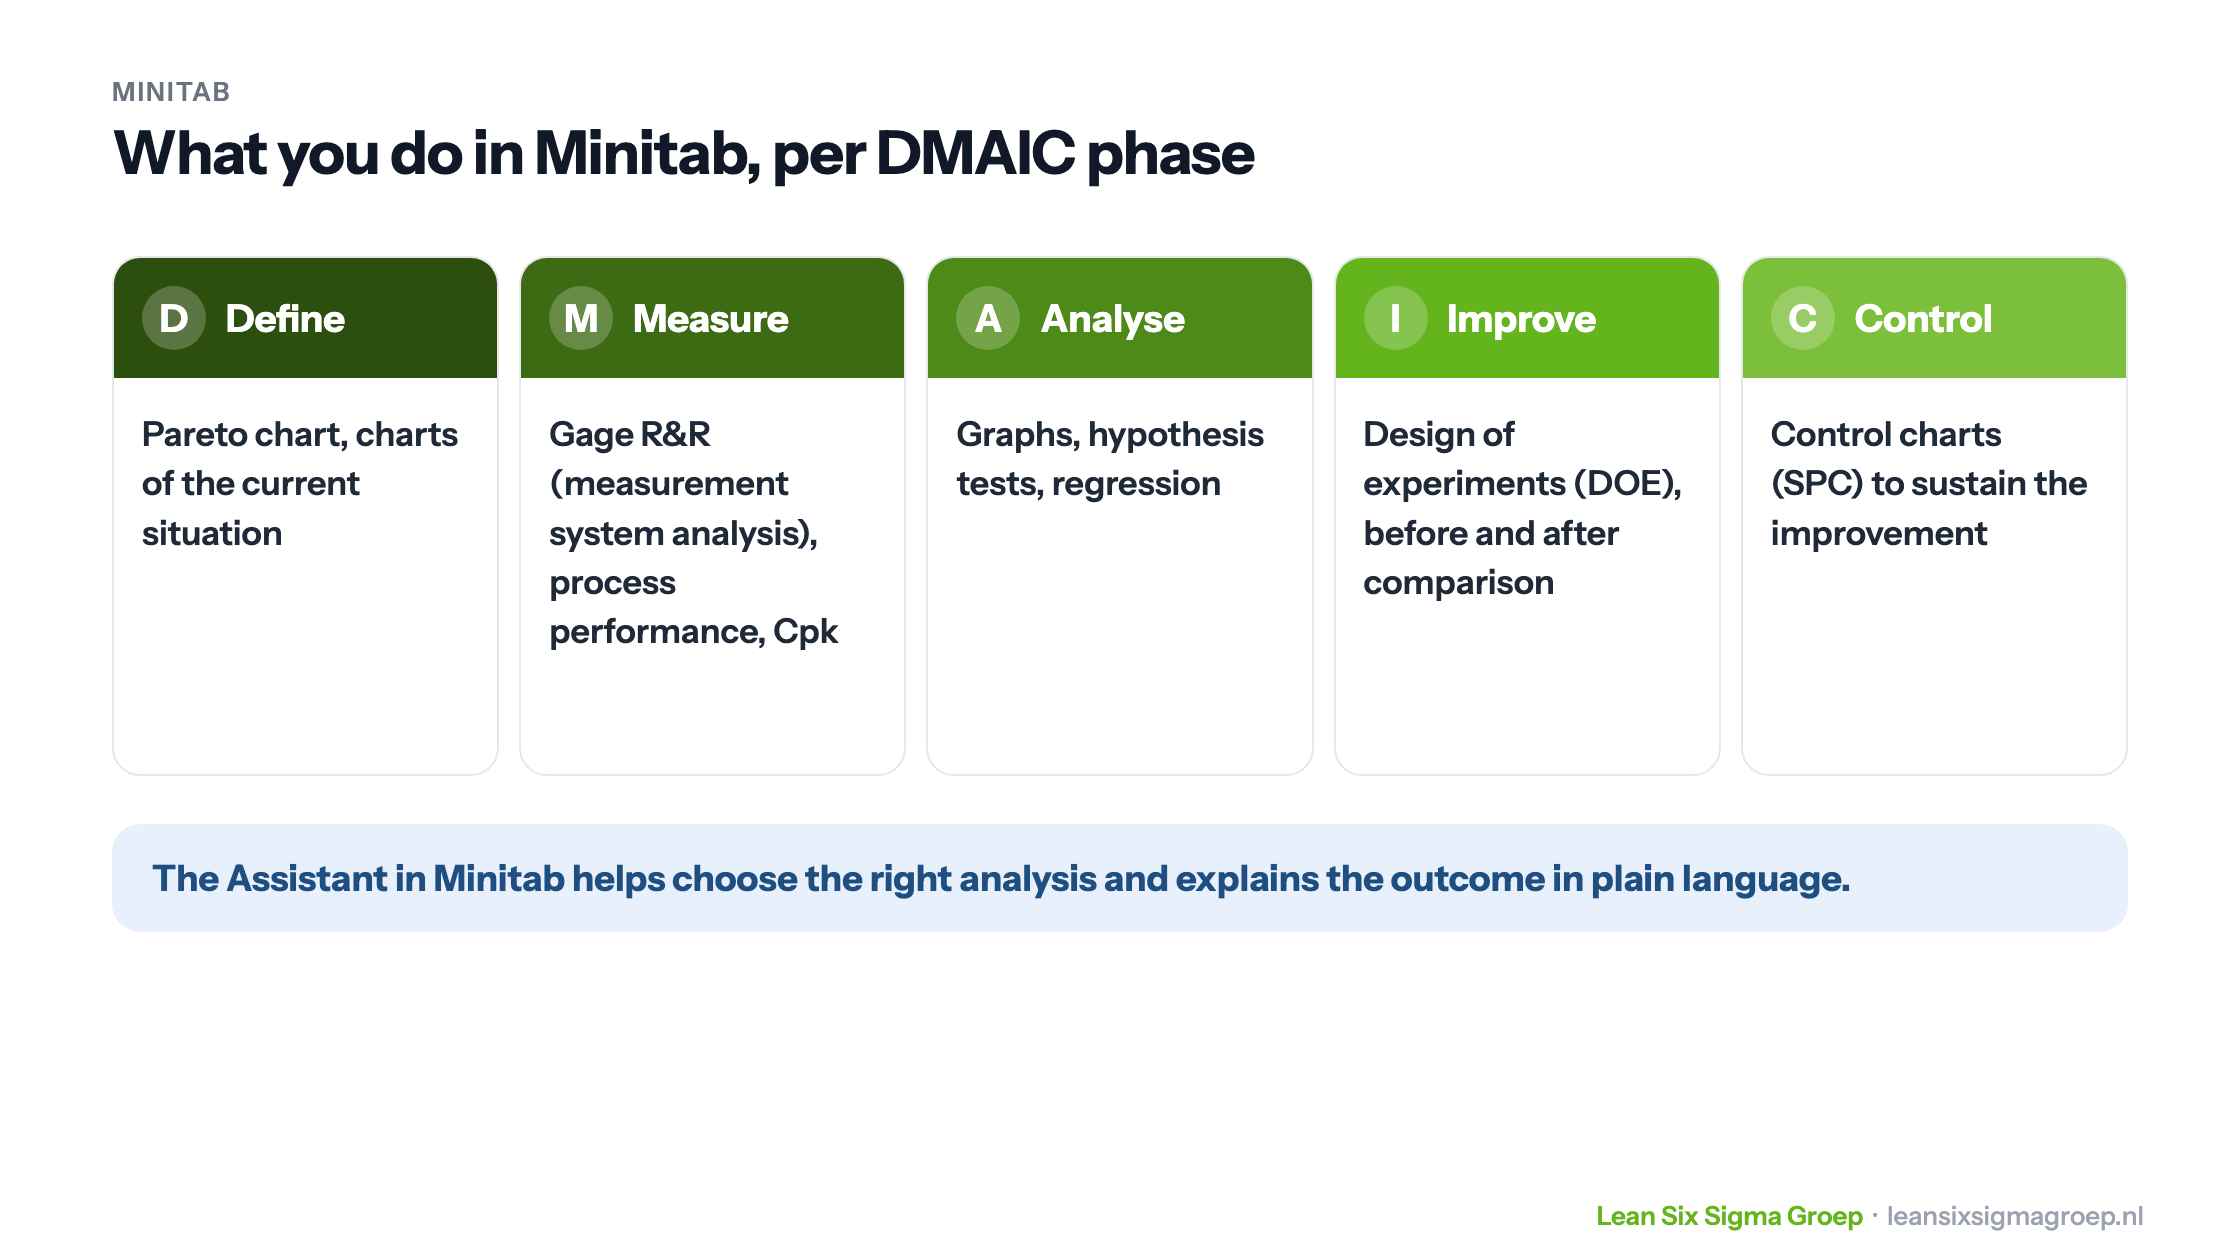
A Lean Six Sigma project follows the steps of DMAIC, and Minitab is useful in almost every step, as shown in the image at the top of this article.
Define and Measure: how big is the problem?
As a Black Belt you first want to show how big the problem is: how often does it go wrong now, compared with what the customer wants? Minitab turns this into a process capability analysis, with a graph of the spread against the customer requirements and a calculation of the defect rate and the Cpk.
For that you need to be able to trust your measurements. With a Gage R&R you check whether the measurement system is reliable enough: do different people measure the same, and does one person measure consistently? That is hard in Excel without add-ins; in Minitab it is a standard analysis.
Analyse: what is the cause?
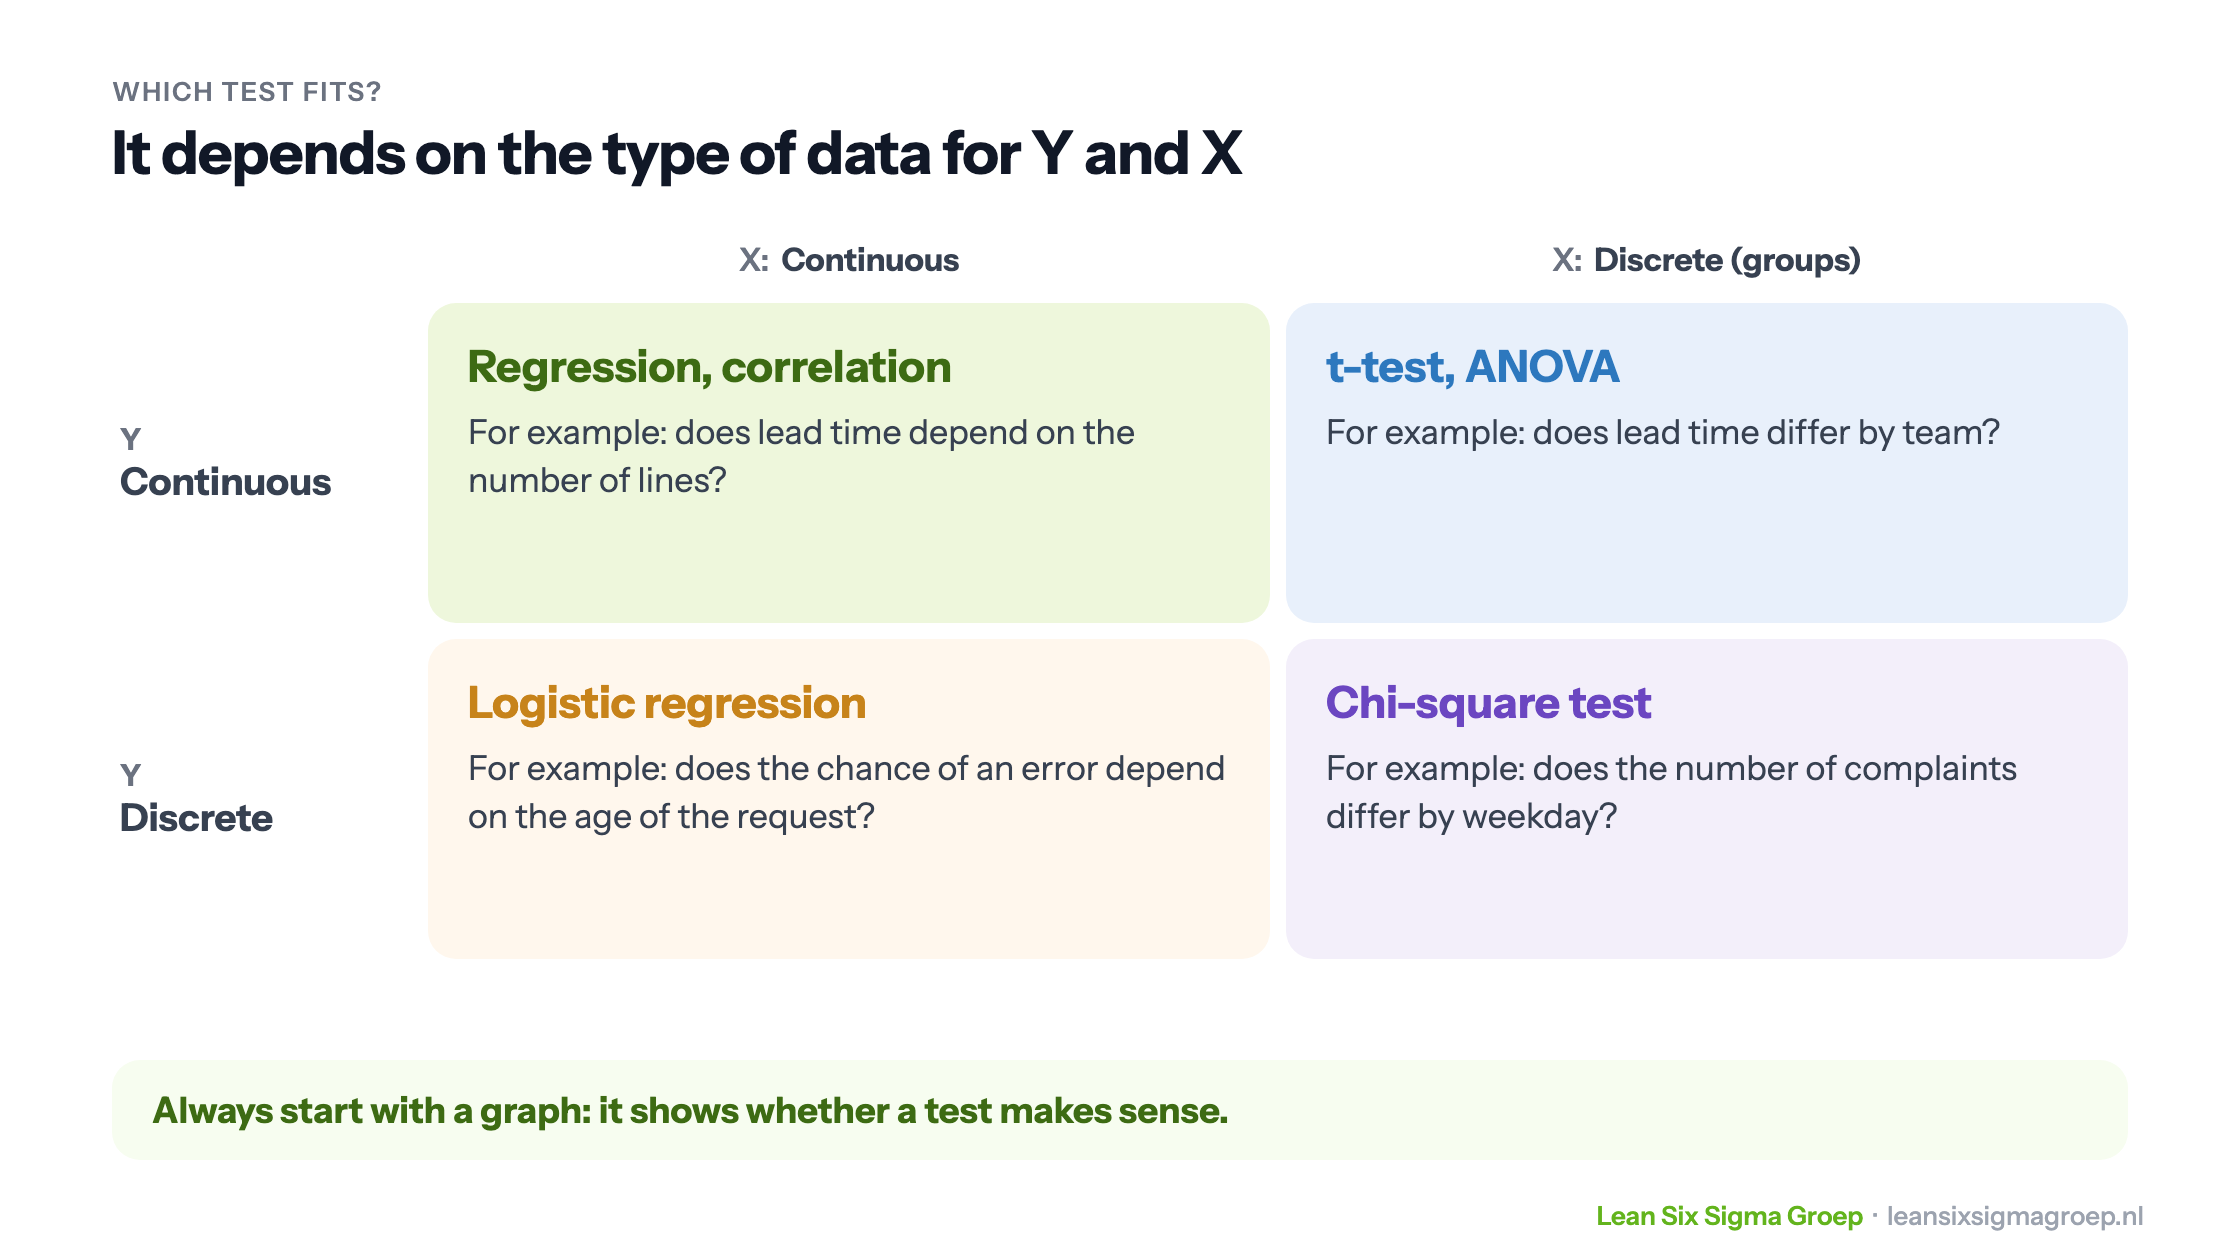
To establish causes objectively, you use graphs, such as a histogram or box plot, and hypothesis tests. They show whether the effect of a possible cause is larger than chance. The causes that remain are called the critical Xs. Which test you use depends on the type of data, as shown below.
Improve and Control: does the solution work, and does it keep working?
In the Improve phase you compare the situation before and after an improvement, or use a design of experiments to find the best settings for a process. In the Control phase you monitor the result with control charts (statistical process control, SPC). They signal when the process drifts, before the problem returns.
Minitab has an Assistant that guides you in choosing the right analysis and explains the outcome in plain language. Handy for those who don’t work with statistics every day.
Minitab or Excel?
For simple graphs and calculations Excel is fine, and many Green Belts manage with it. For measurement system analyses, process capability, extensive hypothesis tests, control charts and designed experiments, specialised software is much faster and less error-prone. Minitab is a popular choice there. Alternatives include JMP, Excel add-ins such as SigmaXL, and programming languages such as R and Python.
Start with a graph
A tip our trainers keep repeating: don’t start with a test, start with a graph. A graph shows whether something is going on, whether the data looks odd, and whether a test makes sense. Statistics is a tool to confirm a suspicion, not to go searching without one.