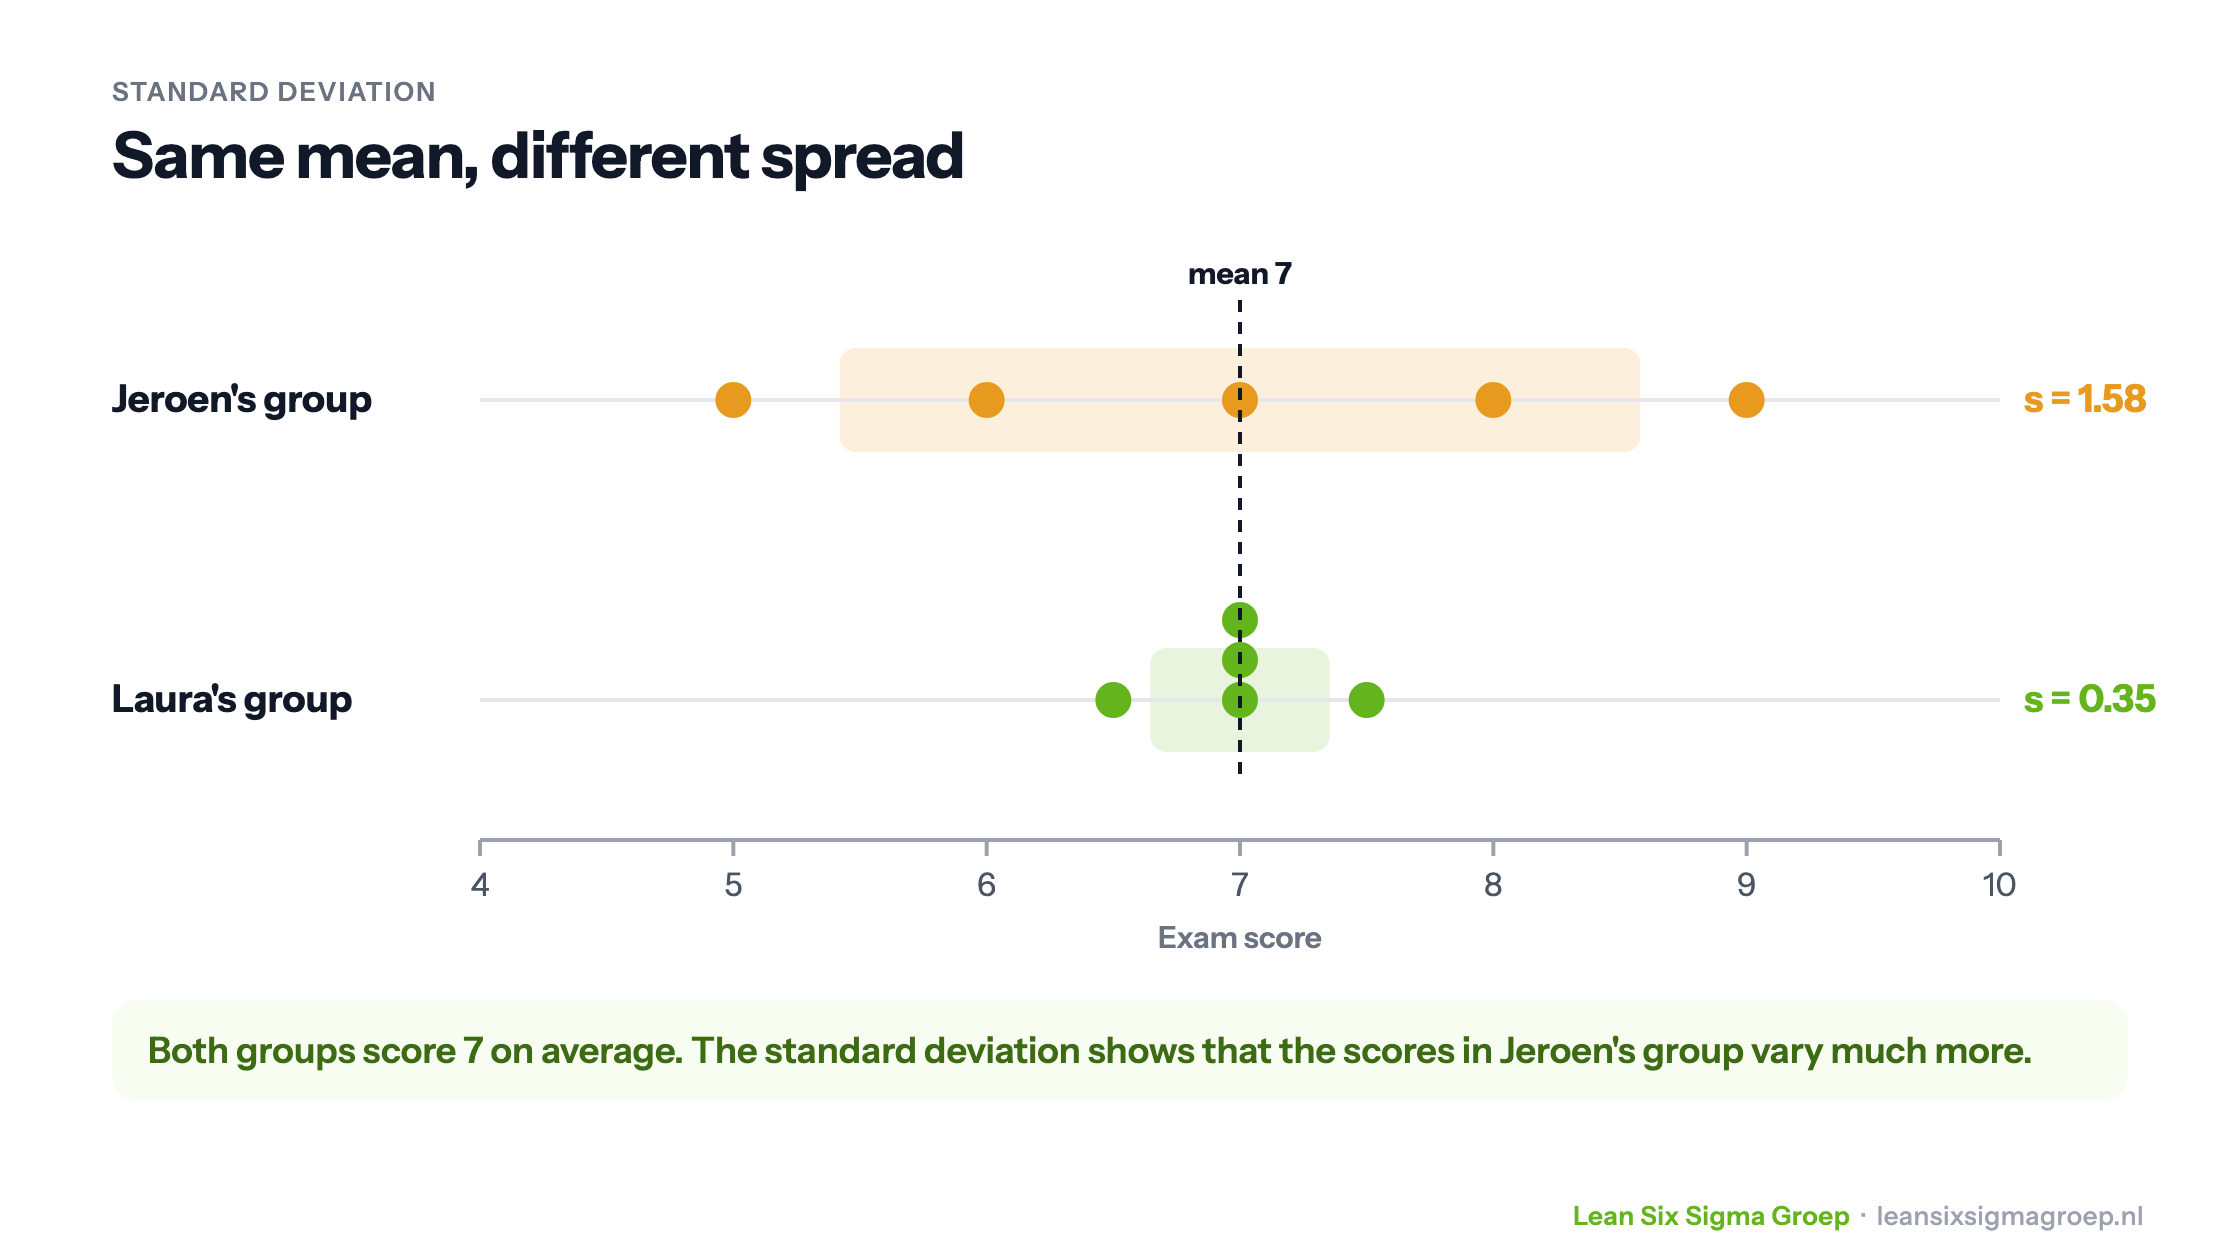
The standard deviation is a measure of spread: on average, how far do the values in a dataset lie from the mean? A mean on its own tells you little. Only with the standard deviation do you know whether all values are close together or far apart.
What is the standard deviation?
The standard deviation is written with the Greek letter σ (sigma) for a whole population, and with s for a sample.
The image at the top of this article shows why you need it. Two trainers, Jeroen and Laura, compare the exam scores of their Green Belt groups. Both groups score 7 on average. But in Jeroen’s group the scores range from 5 to 9, while in Laura’s group they lie between 6.5 and 7.5. The standard deviation of Jeroen’s group is 1.58, that of Laura’s group 0.35. That insight helps Jeroen give extra explanation where it is needed.
How to calculate the standard deviation
- Calculate the mean: add up all values and divide by the number of values.
- Calculate the deviations: subtract the mean from each value.
- Square the deviations: multiply each deviation by itself, so negative deviations don’t cancel out positive ones.
- Calculate the variance: add up the squares and divide by the number of values (N) for a population, or by the number minus one (n − 1) for a sample.
- Take the square root: the square root of the variance is the standard deviation, back in the same unit as your data.
Below you can see the calculation for Jeroen’s group, with the formulas for a population and a sample.
In the Black Belt training you go into this in more depth, with statistical analysis.
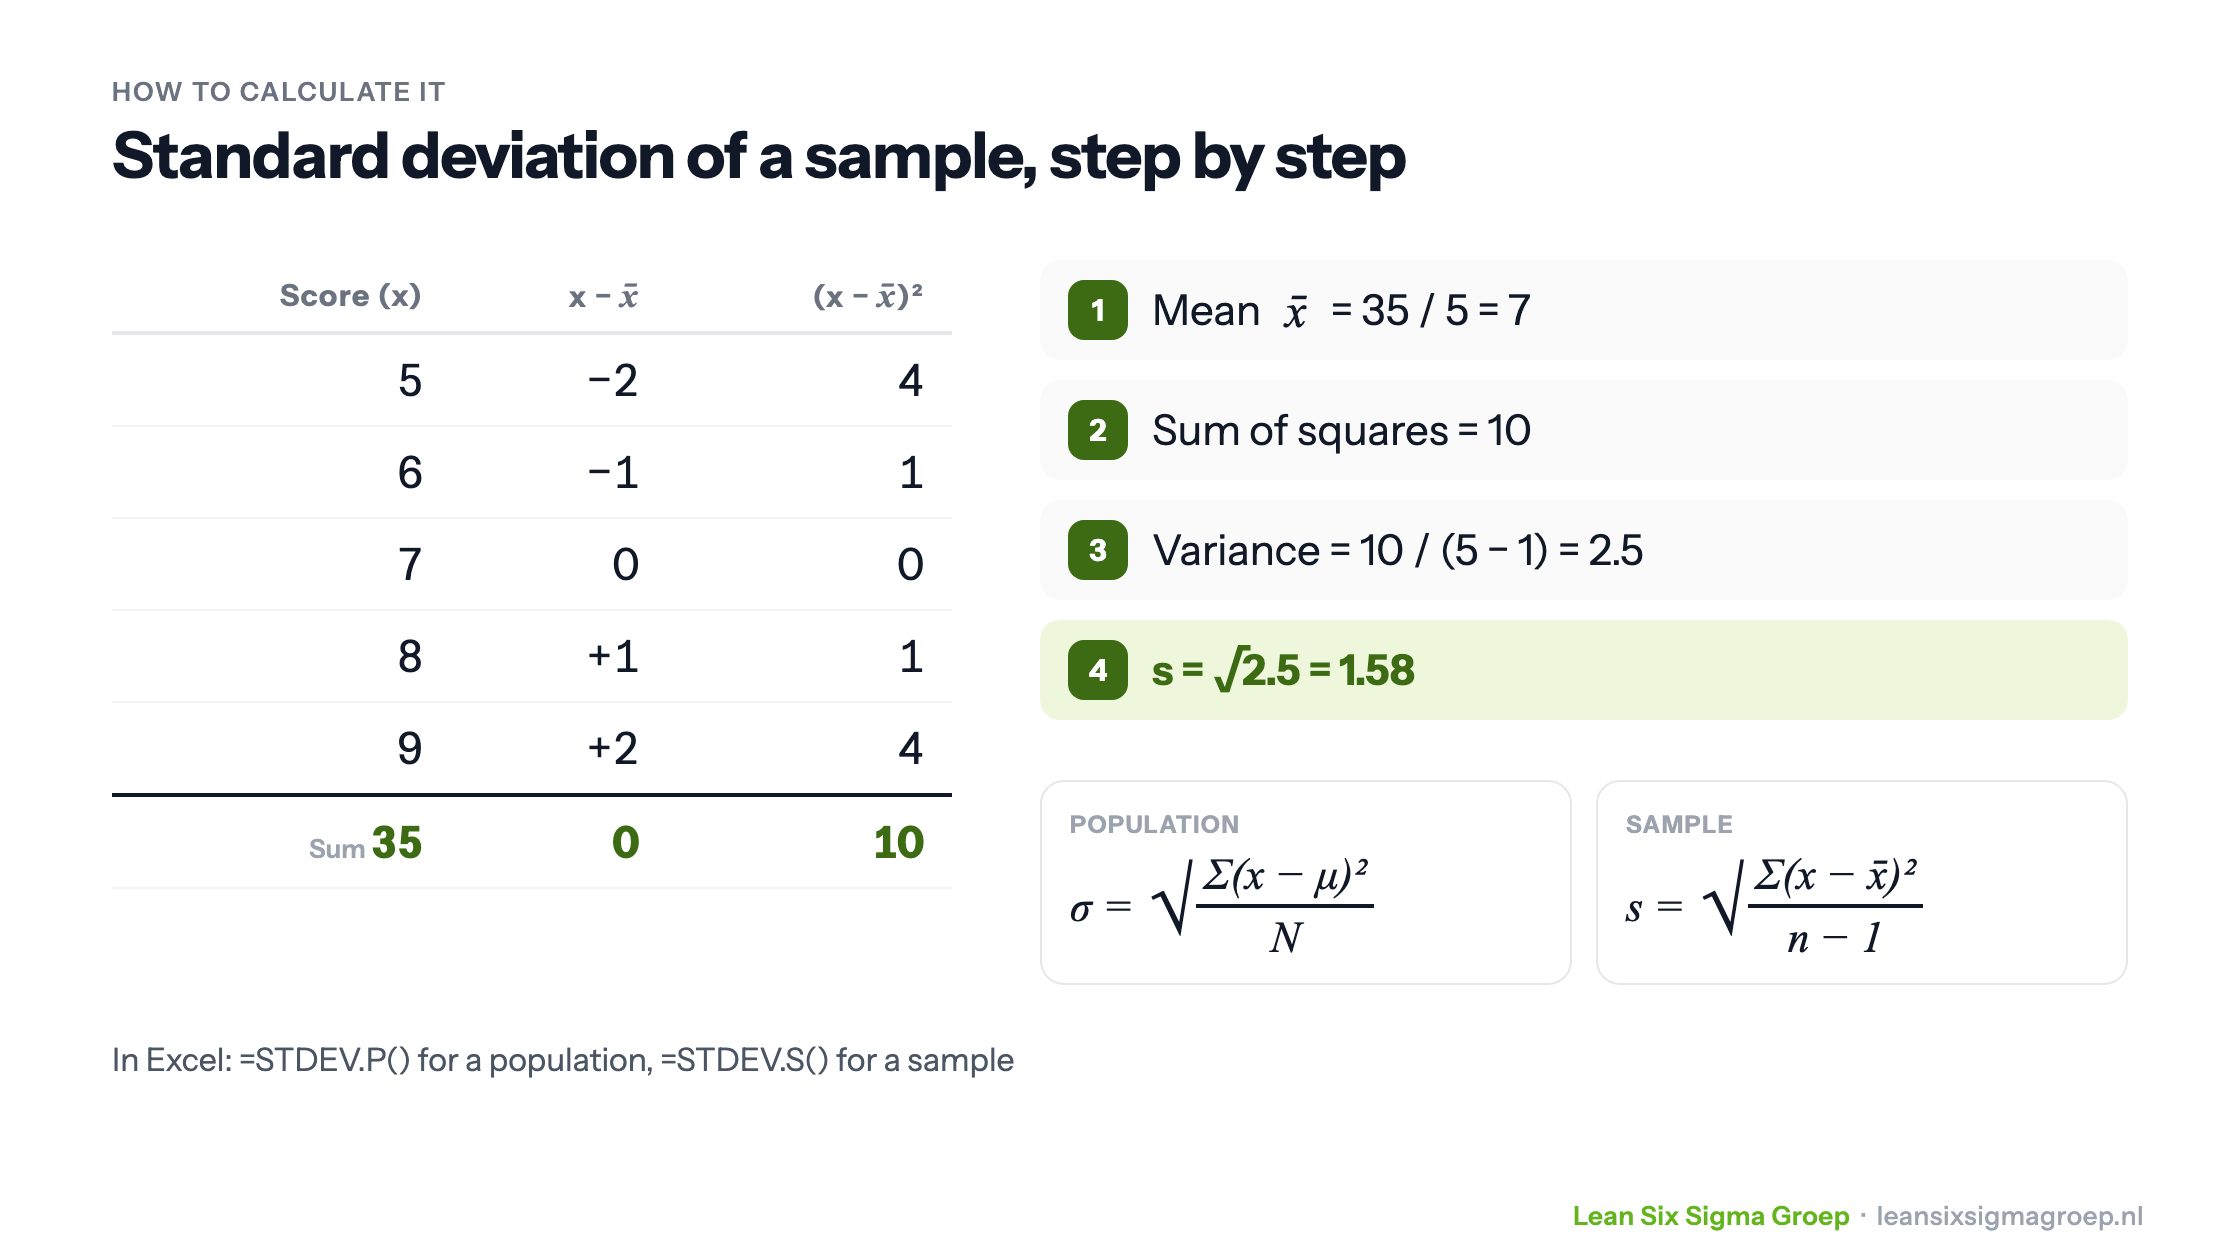
Why divide by n − 1 for a sample? A sample shows slightly less spread than the whole population on average, because you measure the deviations from the mean of that same sample. Dividing by n − 1 corrects for that.
In Excel you use =STDEV.P() for a population and =STDEV.S() for a sample. If you have all the data there is, it is a population; if you measured part of it, it is a sample.
Why is the standard deviation important?
A low standard deviation means the values are close to the mean, a high one that they vary widely. That matters in many situations:
- Education: are students’ results similar, or do they vary a lot?
- Business: how much do sales figures fluctuate, and how well can a process stay within the customer’s specifications?
- Healthcare: how differently do patients respond to a treatment?
Standard deviation and Six Sigma
Six Sigma aims to improve processes by reducing defects and variation. The name says it all: sigma is the standard deviation. In a Six Sigma process, the customer’s limits lie six standard deviations from the process mean. Because a process shifts somewhat over the long term, a margin of 1.5 sigma is used. What remains, 4.5 sigma, corresponds to 3.4 defects per million opportunities.
The smaller the standard deviation, the more standard deviations fit between the mean and the limit, and the fewer defects. That is why improvement in Six Sigma so often comes down to reducing variation. Also read about Cp and Cpk, which express exactly this.
Normally and non-normally distributed data
In a normal distribution, the symmetrical bell curve, about 68% of values lie within one standard deviation of the mean, 95% within two and 99.7% within three. That makes prediction easy.
Not all data is normally distributed. With skewed distributions, such as lead times, or data with two peaks, the standard deviation can give a misleading picture, because outliers have a lot of influence on it. Then the interquartile range, the spread of the middle half of the values, gives a better picture.
Points to watch
- Outliers: a single extremely high or low value can increase the standard deviation considerably. So always check for outliers, and decide whether they rightly belong in the data.
- Look first, then calculate: make a histogram or a chart over time before you calculate with the standard deviation. That shows whether the data is normally distributed and stable.
Conclusion
The standard deviation shows how much spread there is in your data. Whether you are a student, researcher or process improver: understanding the standard deviation helps you read data better and make better decisions. Working with variation and process capability is covered in depth in the Green Belt training course.