What is a Baseline Measurement?
A baseline measurement is an objective measurement of the current situation. In the Measure phase of a Lean Six Sigma approach, you map the current process and determine how well it performs against what the customer wants. This is crucial: without a reliable starting point, you cannot tell whether your improvements actually make a difference.
Example: A local council is receiving more and more complaints about long waiting times for building permits. Residents expect a decision within 40 days, but many applications take longer. Before the council can step in, it first needs to understand how often and why things go wrong. It does this with a baseline measurement.
How do you carry out a Baseline Measurement?
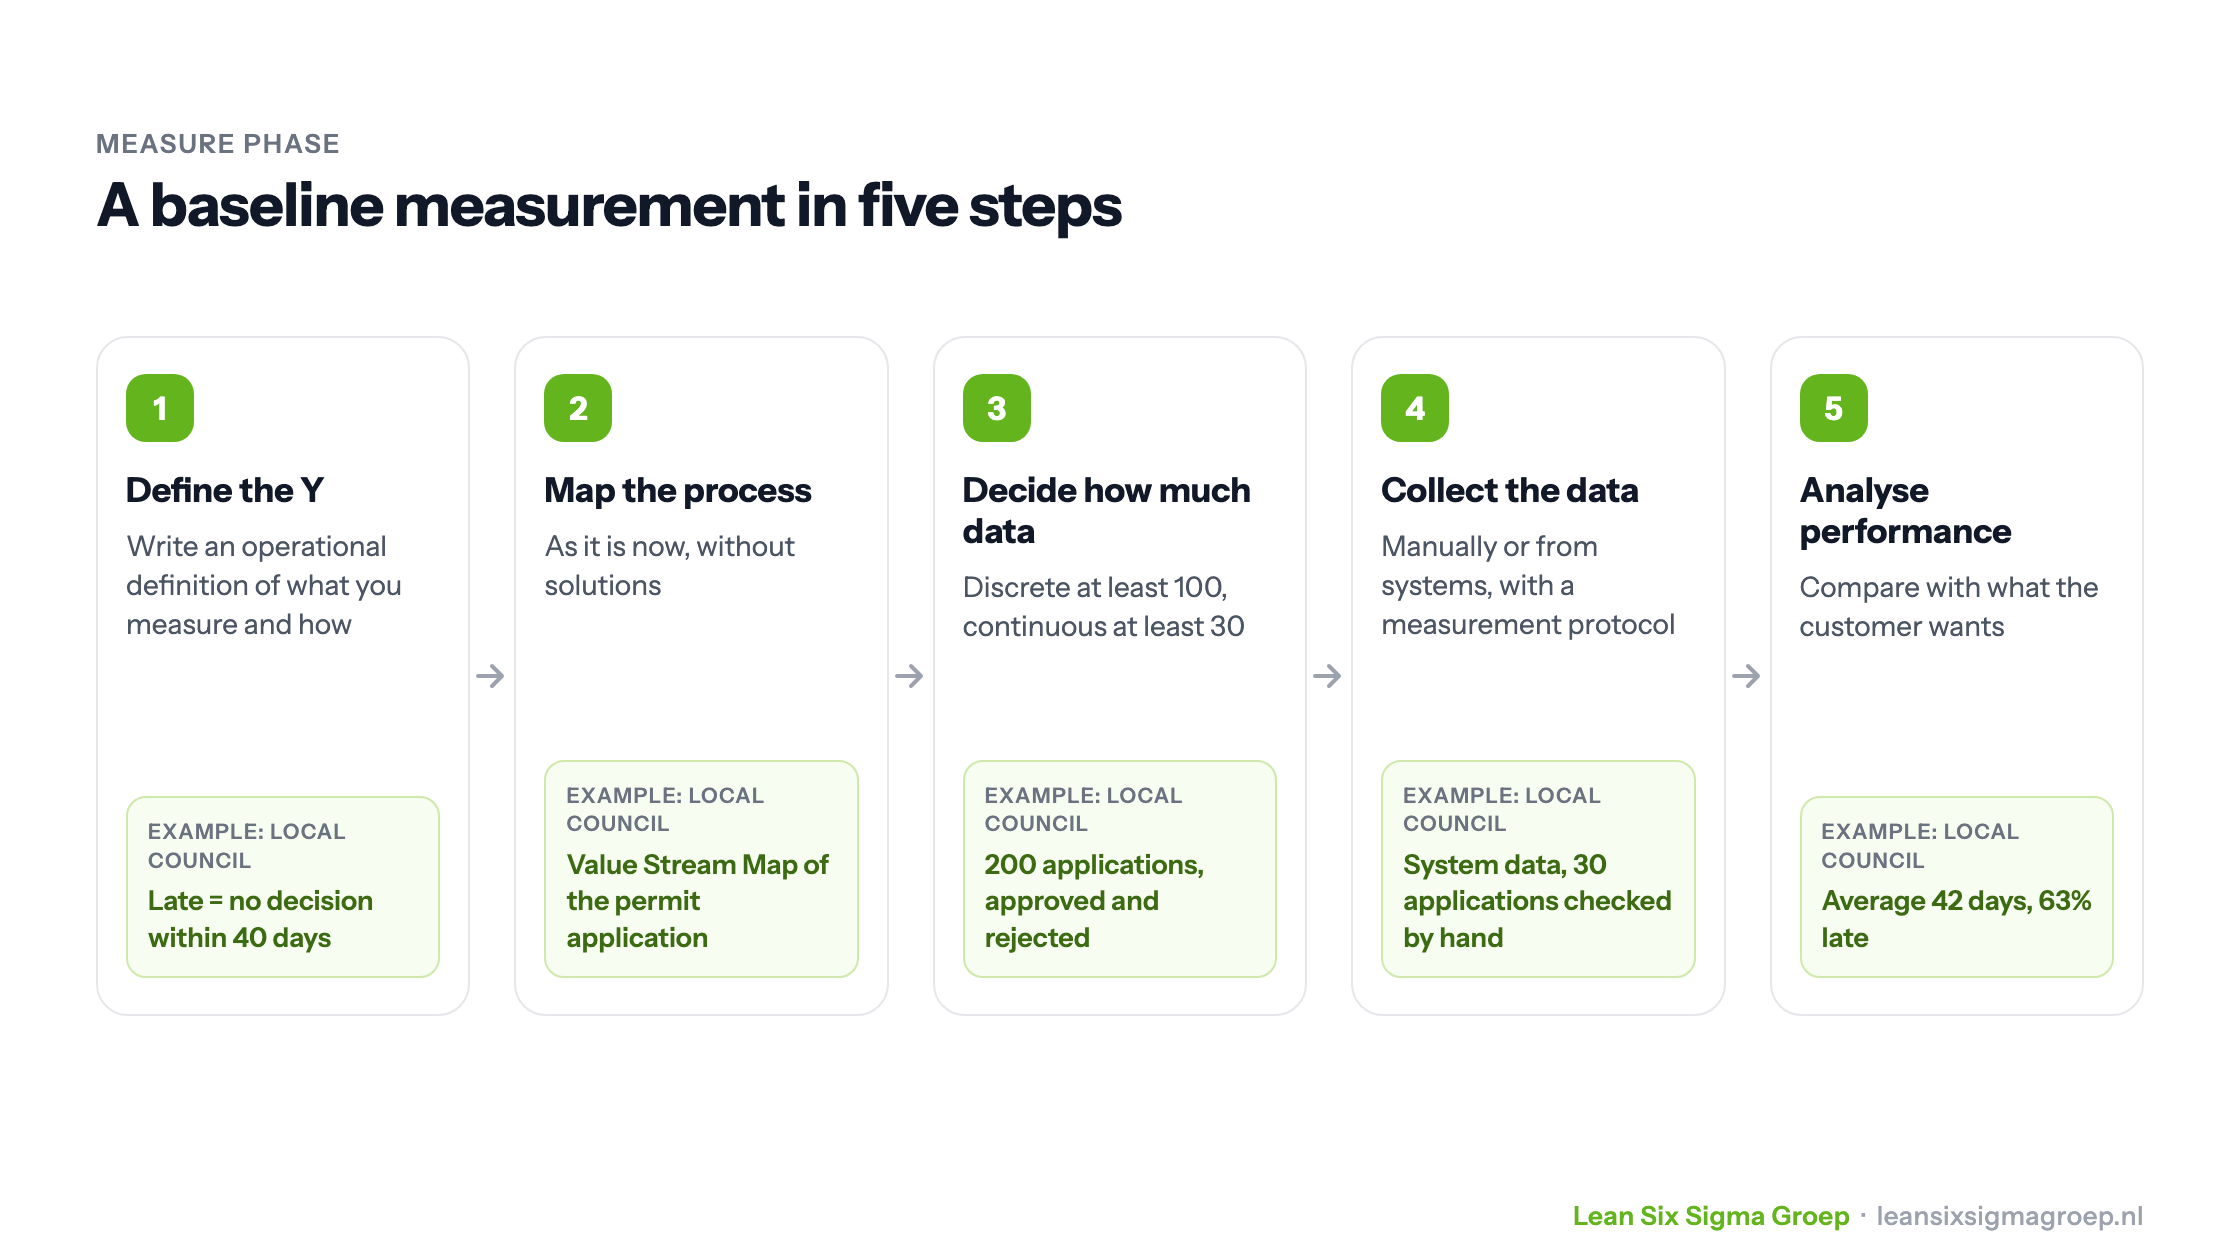
We take you through five practical steps.
Step 1: Define the Y: What Are You Going to Measure?
A crucial first step is to define clearly what you measure and how you measure it. You record this in an operational definition. An operational definition is essentially an instruction that describes exactly how the measurement should be carried out, so that everyone does it the same way.
Example: The council defines a “late permit” as an application that has not been decided within 40 days of submission. This means only the time between receipt and decision is considered, without taking other factors, such as incomplete applications, into account.
Step 2: Map the Current Process
Before you collect data, you need to understand how the process really works. That means capturing the process as it is today, without already adding solutions. Work together with the people in the process and choose a suitable technique:
- Process map: the standard view of the process steps.
- Swimlane/Makigami: shows who carries out which steps.
- Spaghetti diagram: visualises physical movement.
- Value Stream Map (value stream analysis): focuses on added value and clearly shows where the obstacles, bottlenecks and waste in the process are.
Example: The council chooses a Value Stream Map to find out where delays arise and where time is lost, without making any improvements yet.
Step 3: Decide How Much Data You Need
To arrive at a reliable analysis, you need to collect enough data. How many data points you need depends on the type of data, and matters most when you are working with a sample:
- Discrete (for example: number of late permits) → At least 100 data points.
- Continuous (for example: lead time in days) → At least 30 data points.
These are rules of thumb. The right number depends on the variation in the process, the difference you want to be able to detect and how confident you want to be in your conclusion.
Example: The council decides to collect data on 200 permit applications to get a complete picture. It looks at both approved and rejected applications to get a representative overview.
When putting the dataset together, it is important to make sure it reflects reality. If, for example, only applications for one type of project are analysed, the picture can be distorted.
Step 4: Collect the Data
Data can be collected in different ways:
- Manual recording: staff record the processing time of permits themselves.
- System data: data is taken directly from digital registration systems.
Example: The council chooses to use system data, but notices that some data is missing or inconsistent. It therefore decides to check a sample of 30 applications by hand, to see whether the recorded lead times match reality. This helps prevent errors in the measurement.
On top of that, a clear measurement protocol is drawn up, setting out:
- Who is responsible for collecting the data.
- How and when the data is recorded.
- How the reliability of the data is checked.
Step 5: Analyse Current Process Performance
Now the real work begins: how is the process performing right now? Visualise the data with histograms, Pareto charts or box plots. Process performance is determined against what the customer or organisation wants.
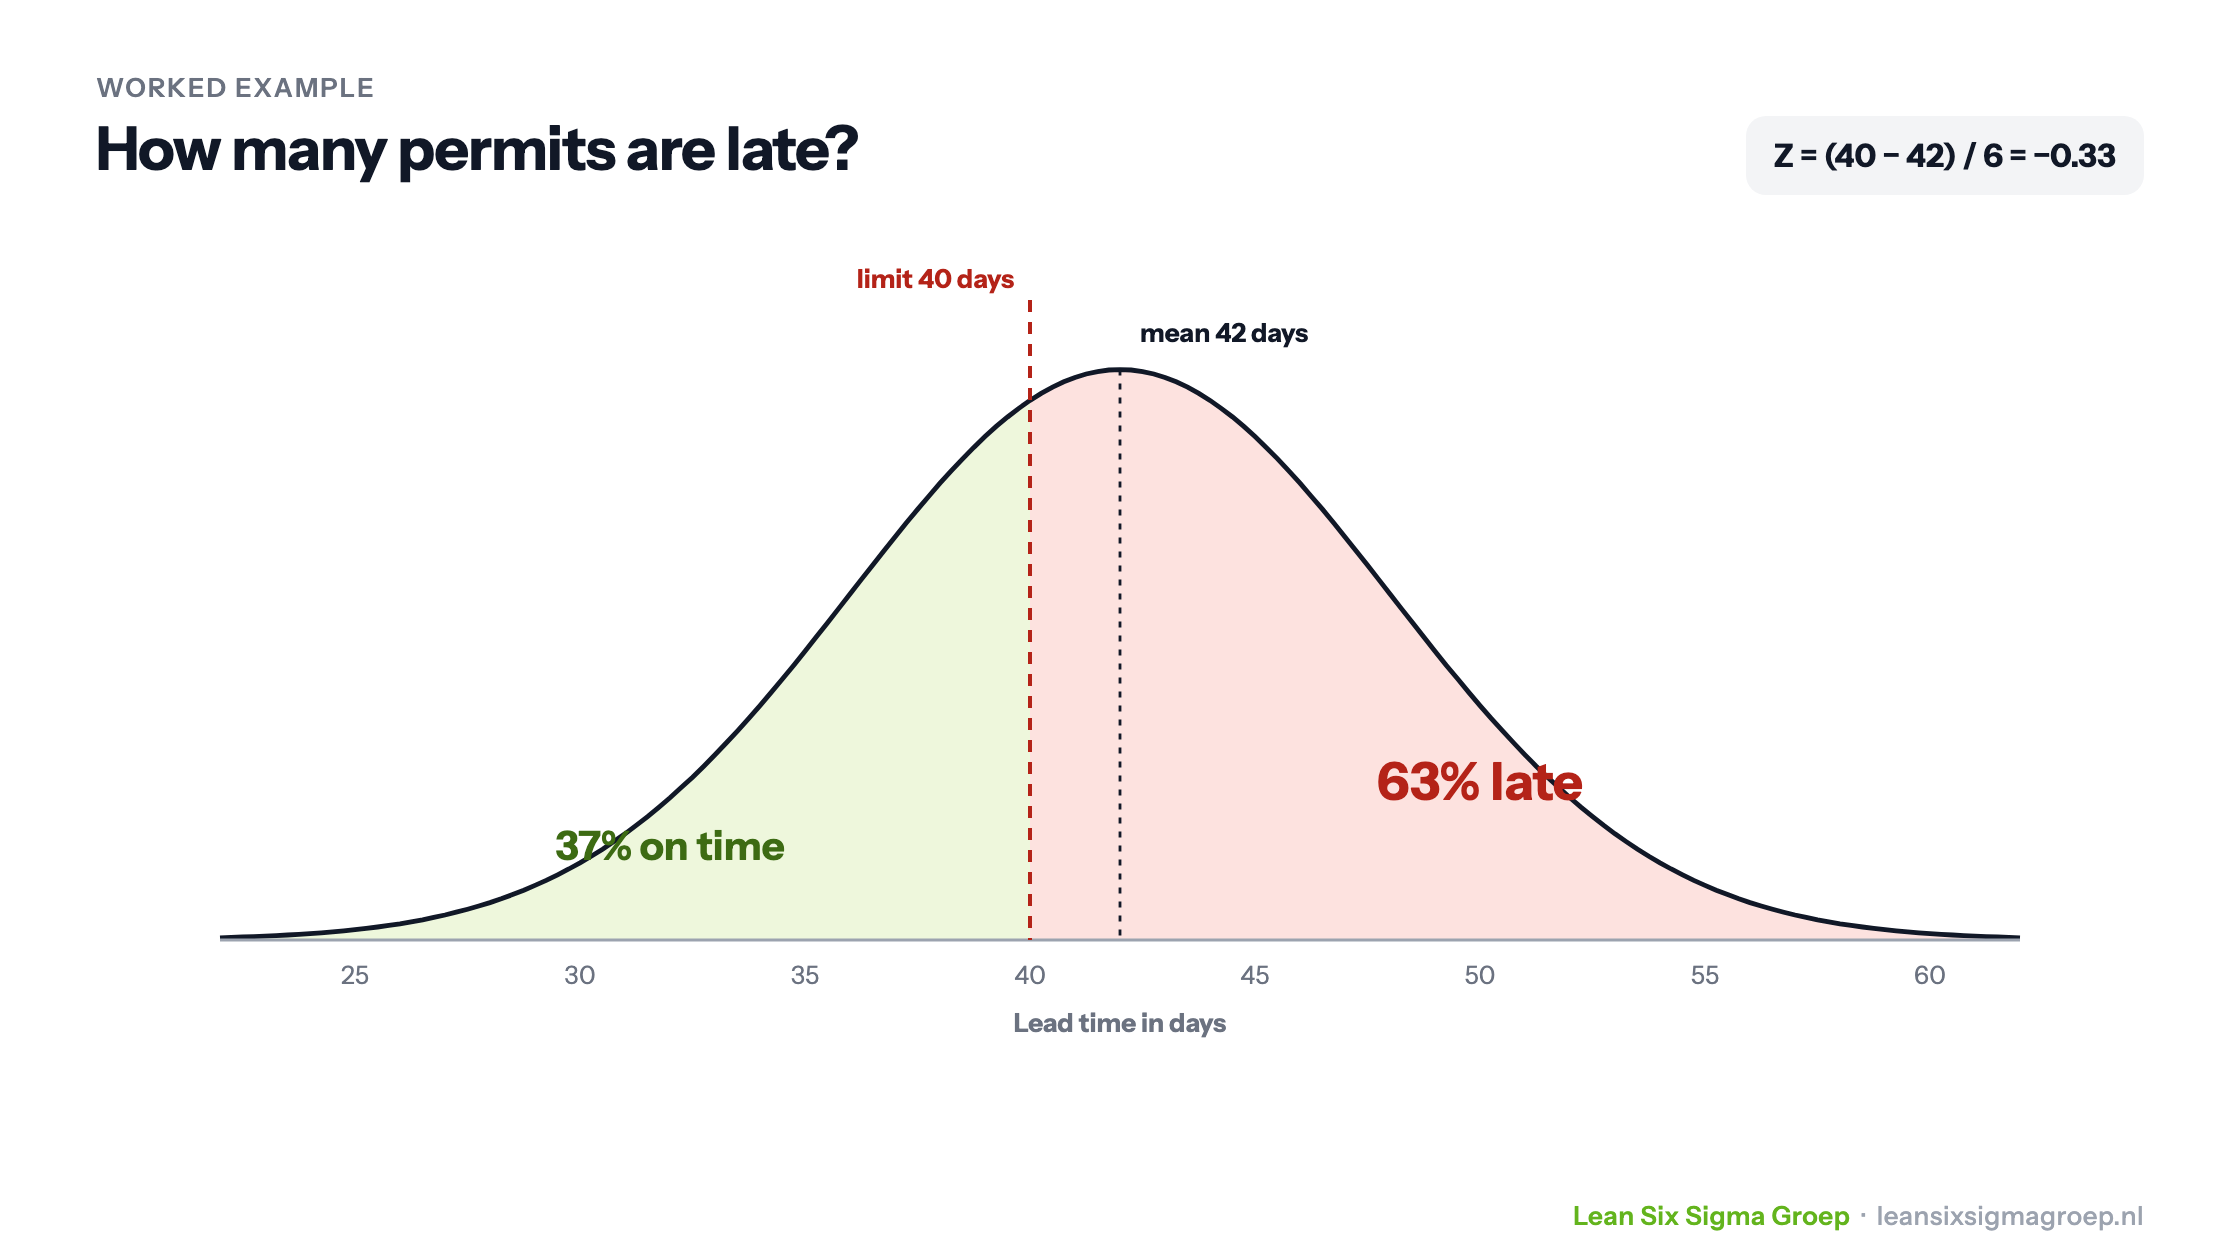
Example calculation: Permit Waiting Time
The average waiting time turns out to be 42 days, with a standard deviation of 6 days. The customer (the resident) expects a decision within 40 days at most.
- Z-value calculation:
- USL = 40 days (upper specification limit)
- Z = (40 – 42) / 6 = -0.33 → This means that roughly 63% of applications are processed late!
Once the Z-value has been calculated, you look up the p(d) (Probability of a Defect) in a table. In this case, roughly 63% of applications turn out not to be processed within the agreed time. This shows there is a structural problem and helps you target improvement actions.
This is one of the tools you learn to apply in the Green Belt training.
What if the Baseline Measurement Shows No Problem?
Sometimes a baseline measurement shows that a problem is smaller than expected. This can have several causes:
- You are not measuring the right aspect: check whether the chosen measurement variables fit the problem. Consider redefining the measurement.
- Quick wins have already been implemented: the process may have improved since the problem was first identified. In that case, it is worth analysing the impact of those improvements further.
- The problem lies at a different level: check whether the bottleneck is somewhere else in the process. For example, the approval time may well be within the norm, while applications are often held up by missing documents.
What can you do? Go back to the Define phase and decide whether the problem statement or the measurement point needs adjusting. Sometimes it helps to add a new measurement point or to look more closely at variation in the process.
Why is a Baseline Measurement Important?
- It prevents assumptions and gut feeling.
- It gives objective insight into how big the problem really is.
- It makes improvements measurable.
- It helps build support within the organisation by showing facts and figures.
Conclusion
A baseline measurement is the foundation of a successful Lean Six Sigma approach. By collecting objective data and mapping the current process properly, you make sure your improvements really have an effect. This helps organisations to keep optimising their processes and increase customer satisfaction.
Want to learn how to carry out a baseline measurement and analyse process performance yourself? Get in touch at [email protected] or call +31 (0)88 53 26 700.