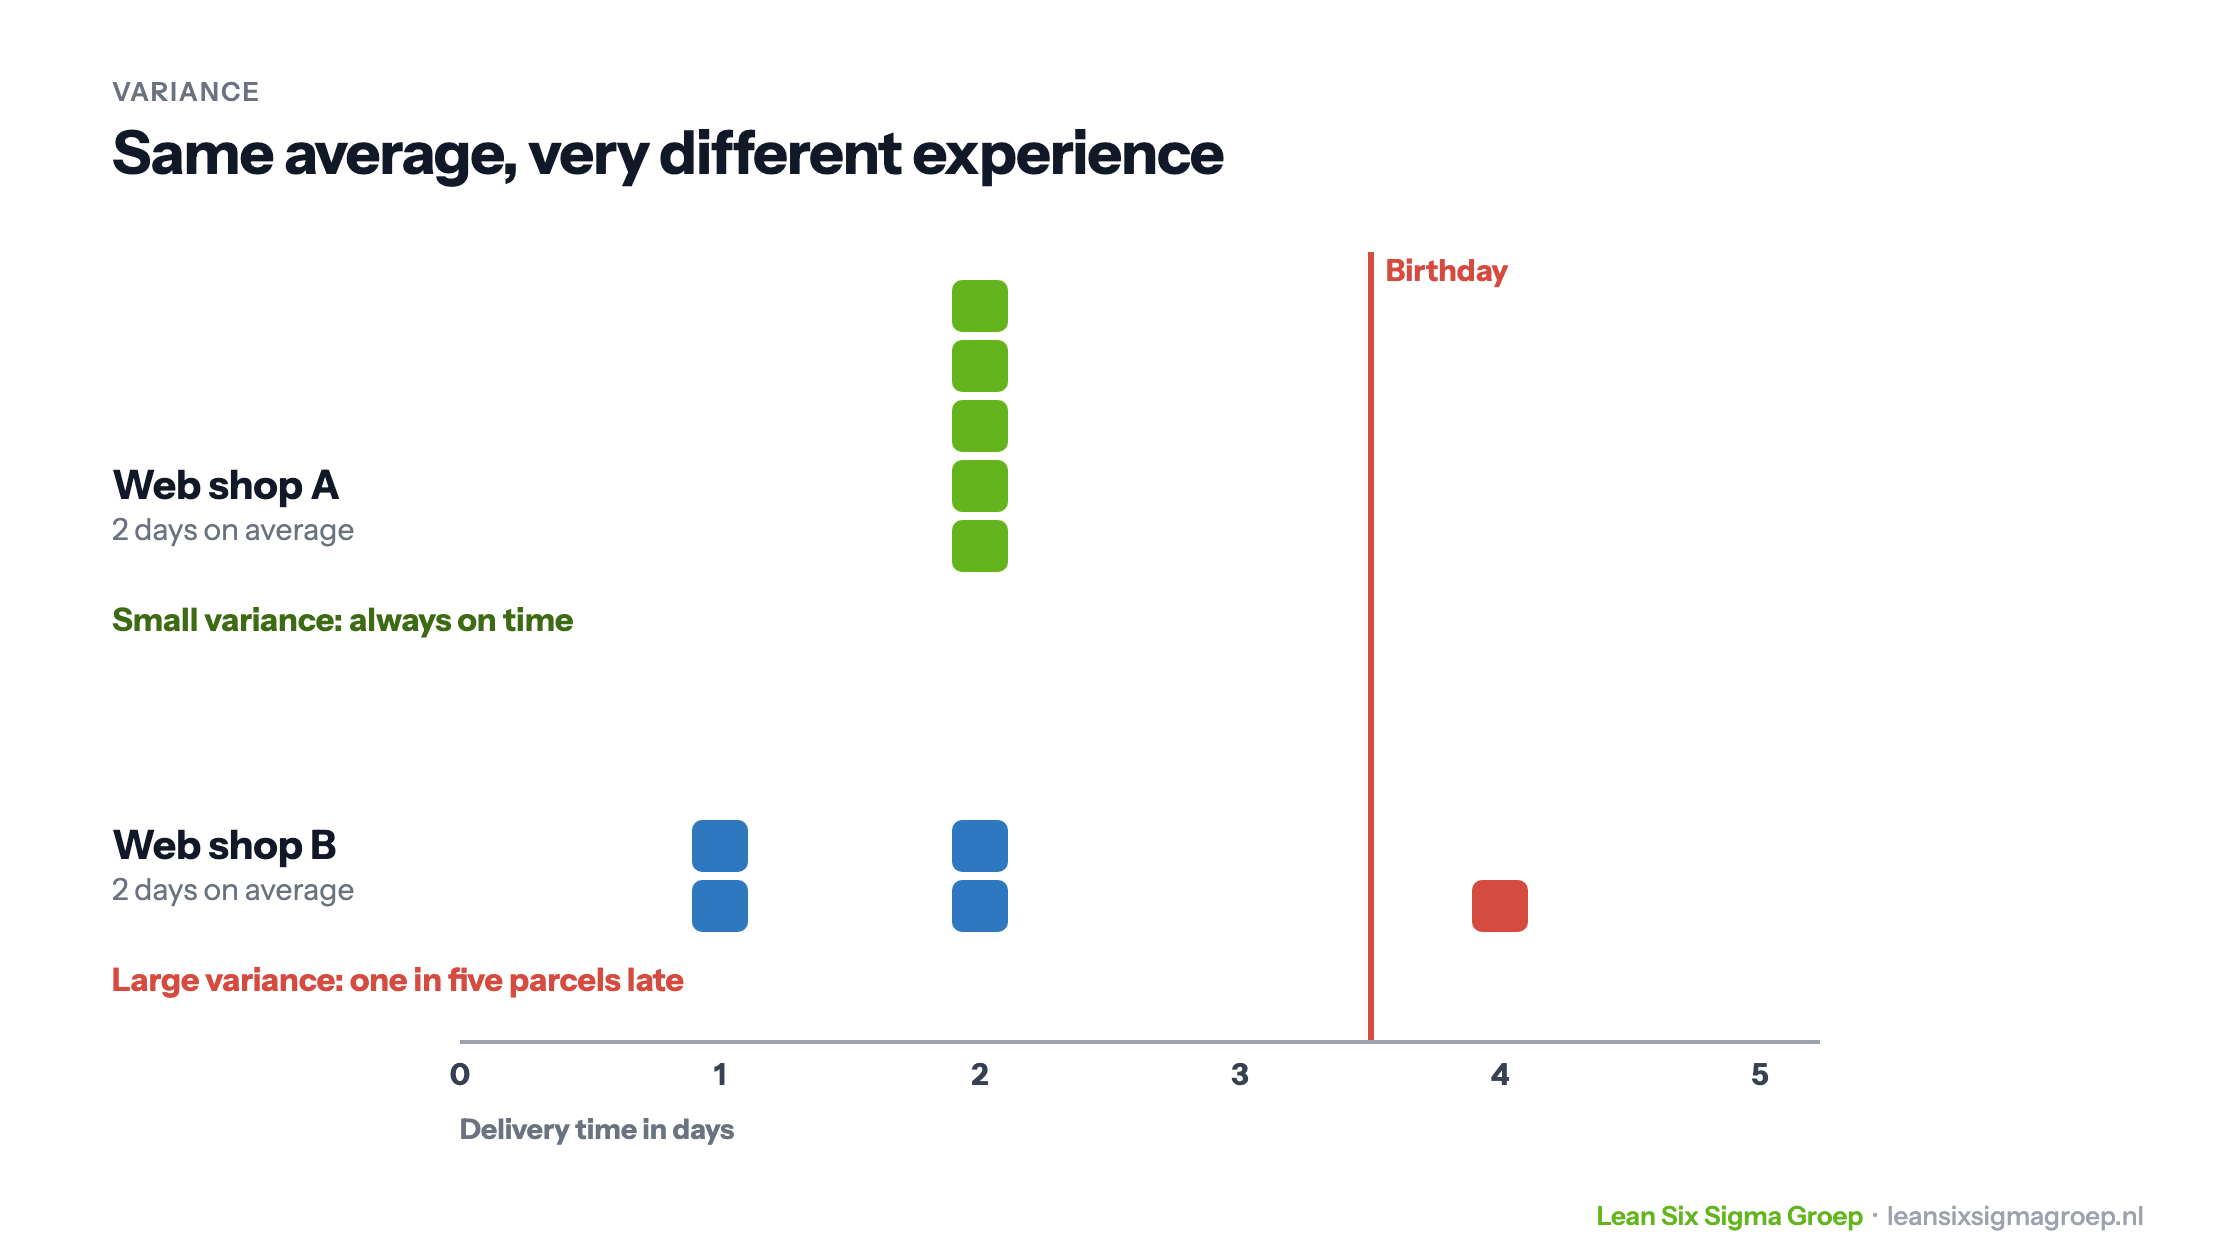
Variance is a measure of spread: how far, on average, are the values from their mean? For a customer, spread is often more important than the average. A parcel that arrives on time on average, but sometimes three days late, is exactly the parcel that misses the birthday. That is why Six Sigma is about reducing variation.
A birthday that nearly fell through
My nephew was turning eleven, and I had forgotten to order a present. The web shop promised next-day delivery, and on average that was fairly accurate. But my parcel was one of the outliers: it arrived after the party. The web shop’s average was fine; its spread was not.
The image at the top of this article shows the difference. Two web shops deliver in two days on average. At web shop A every parcel arrives after two days. At web shop B it varies from one to four days, and one in five parcels is too late for the birthday. The same average, a very different experience.
What is variance?
Variance measures how far the values in a dataset lie from their mean. The larger the variance, the more the values diverge. You calculate it in four steps:
- Calculate the mean.
- Determine each value’s deviation from the mean.
- Square those deviations, so deviations up and down don’t cancel each other out.
- Add up the squares and divide by the number of values minus one (for a sample) or by the number of values (if you have every value of the whole population).
As a formula for a sample: s² = Σ(x – x̄)² / (n – 1). For a full population: σ² = Σ(x – μ)² / N. In practice you almost always work with a sample, and therefore with n – 1.
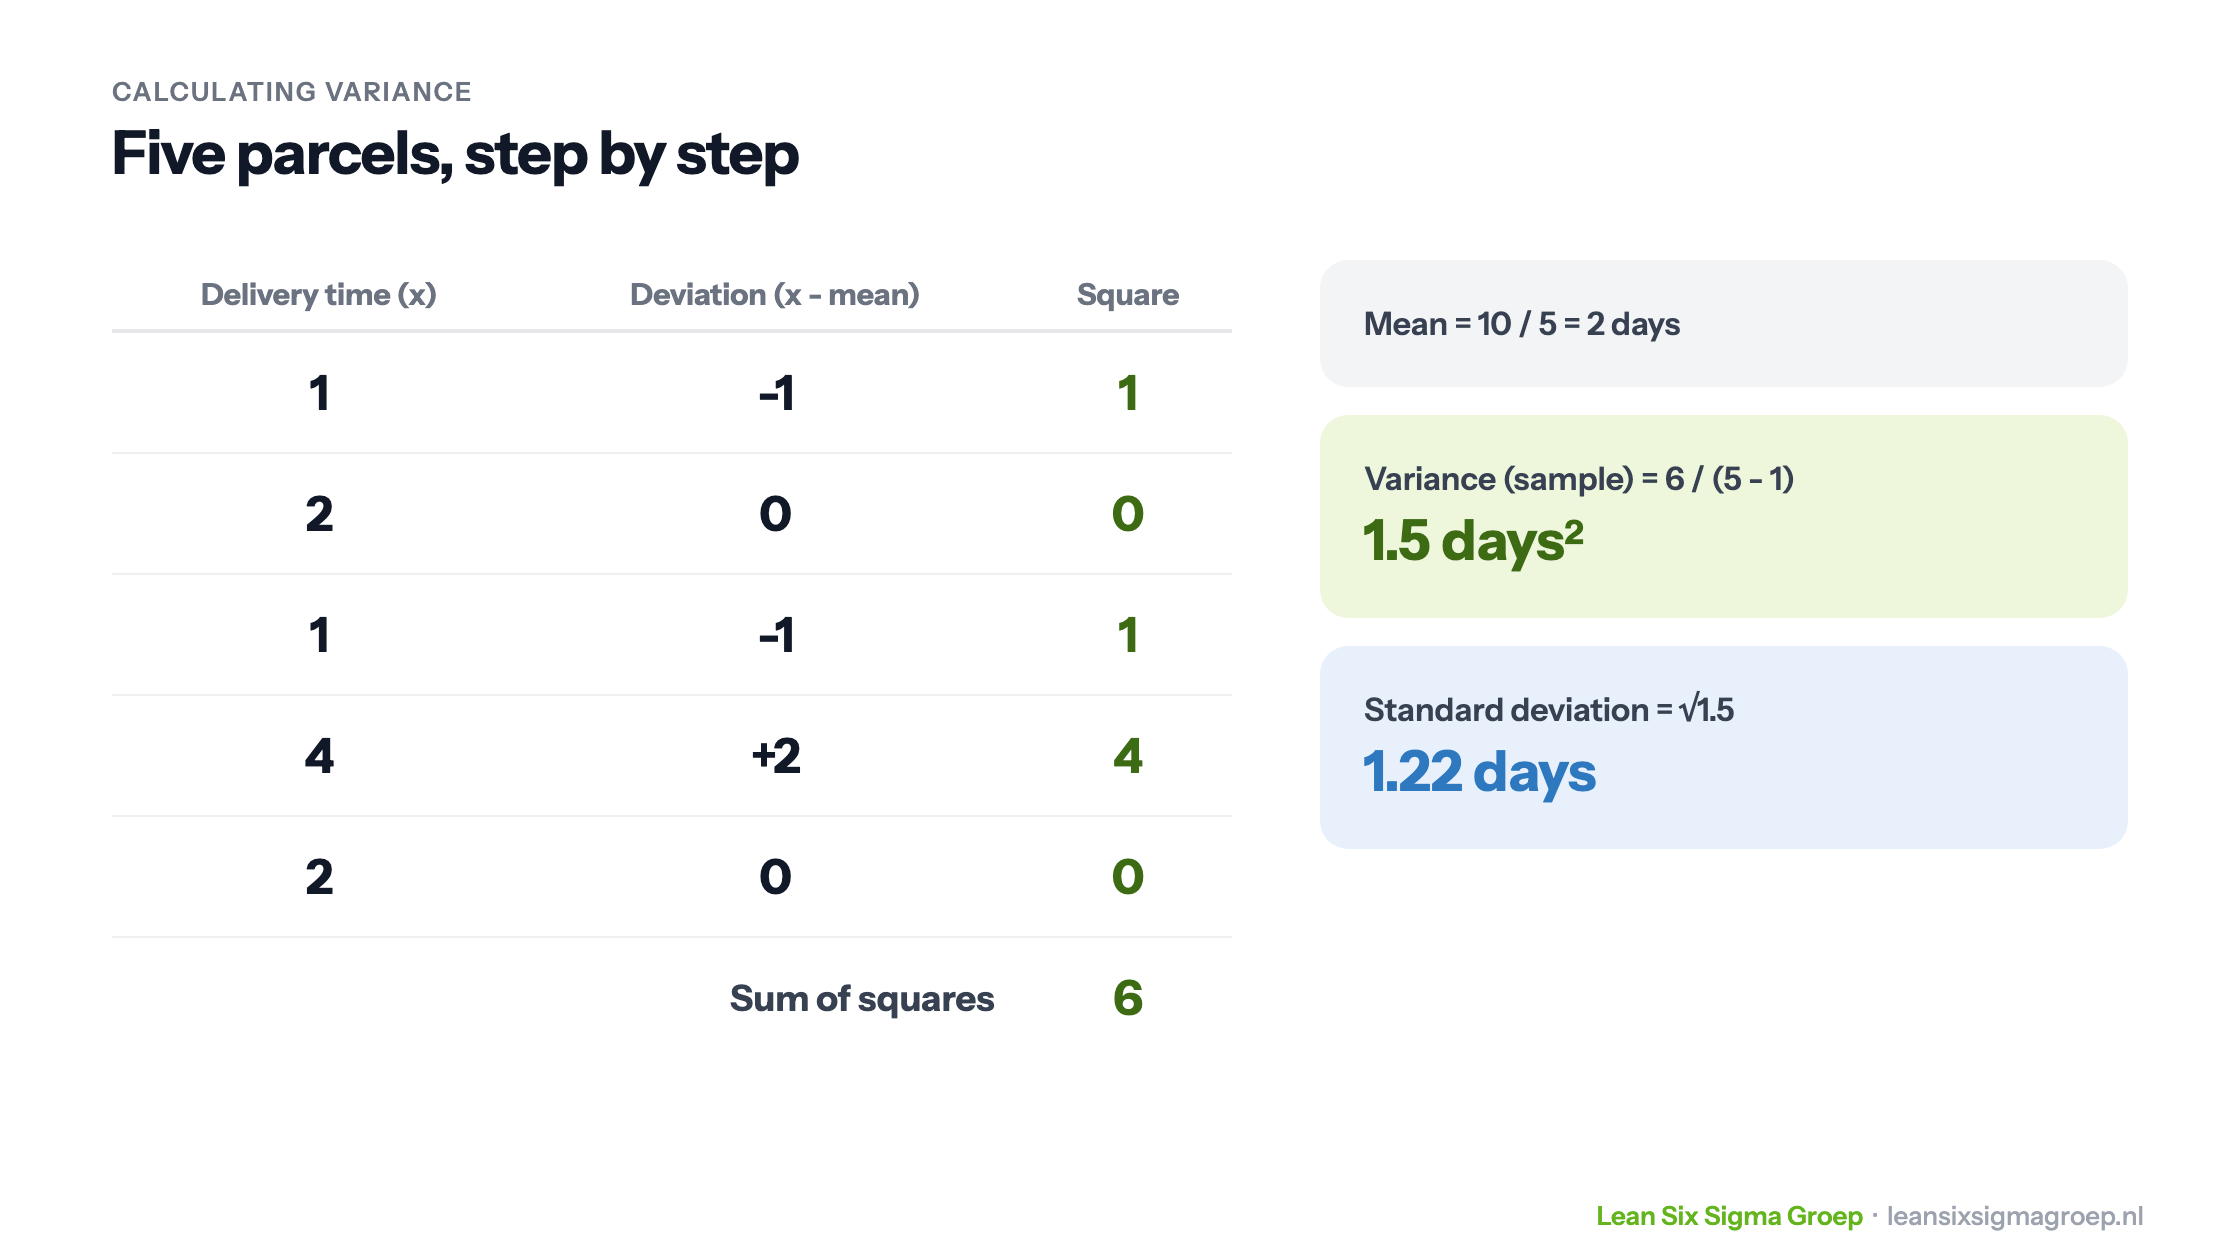
Below is the calculation for web shop B’s five parcels.
In the Black Belt training you go into this in more depth, with statistical analysis.
Variance and standard deviation
Because you square the deviations, variance has an awkward unit: in the example, days squared. That is why in practice you more often use the standard deviation: the square root of the variance, in the same unit as the data. In the example that is 1.22 days. Variance itself is mainly useful in calculations, for instance because variances of independent sources can be added together. That is also the basis of ANOVA, the analysis of variance.
Variance in Lean Six Sigma
Customers don’t experience an average, they experience each delivery individually. Large spread means some customers get something late, short or wrong, even when the average is fine. That is why Six Sigma steers not only on the average, but above all on the spread around the customer requirement. The smaller the spread, the higher the Cpk and the yield.
Note the difference between a large spread and an unpredictable one. A process can have a large but stable spread: always between one and four days. That is predictable, but perhaps not good enough. A process can also have an occasional outlier due to a special cause, such as a strike or a broken machine. A control chart shows which of the two it is, and that determines the approach: improve the whole process, or track down the special cause.
Lean and variation
Lean also helps reduce variation. 5S and standard work make sure work is done the same way every time. Visualisation makes deviations visible quickly. And an even flow of work, as with just in time, prevents peaks that lead to waiting and errors.
Conclusion
Variance reveals what an average hides: how predictable a process is. Measure the spread and tackle its causes, and you deliver more reliably to customers, including uncles who order the present at the last moment.
Want to learn how to measure and reduce spread? The Green Belt course goes into it in depth.