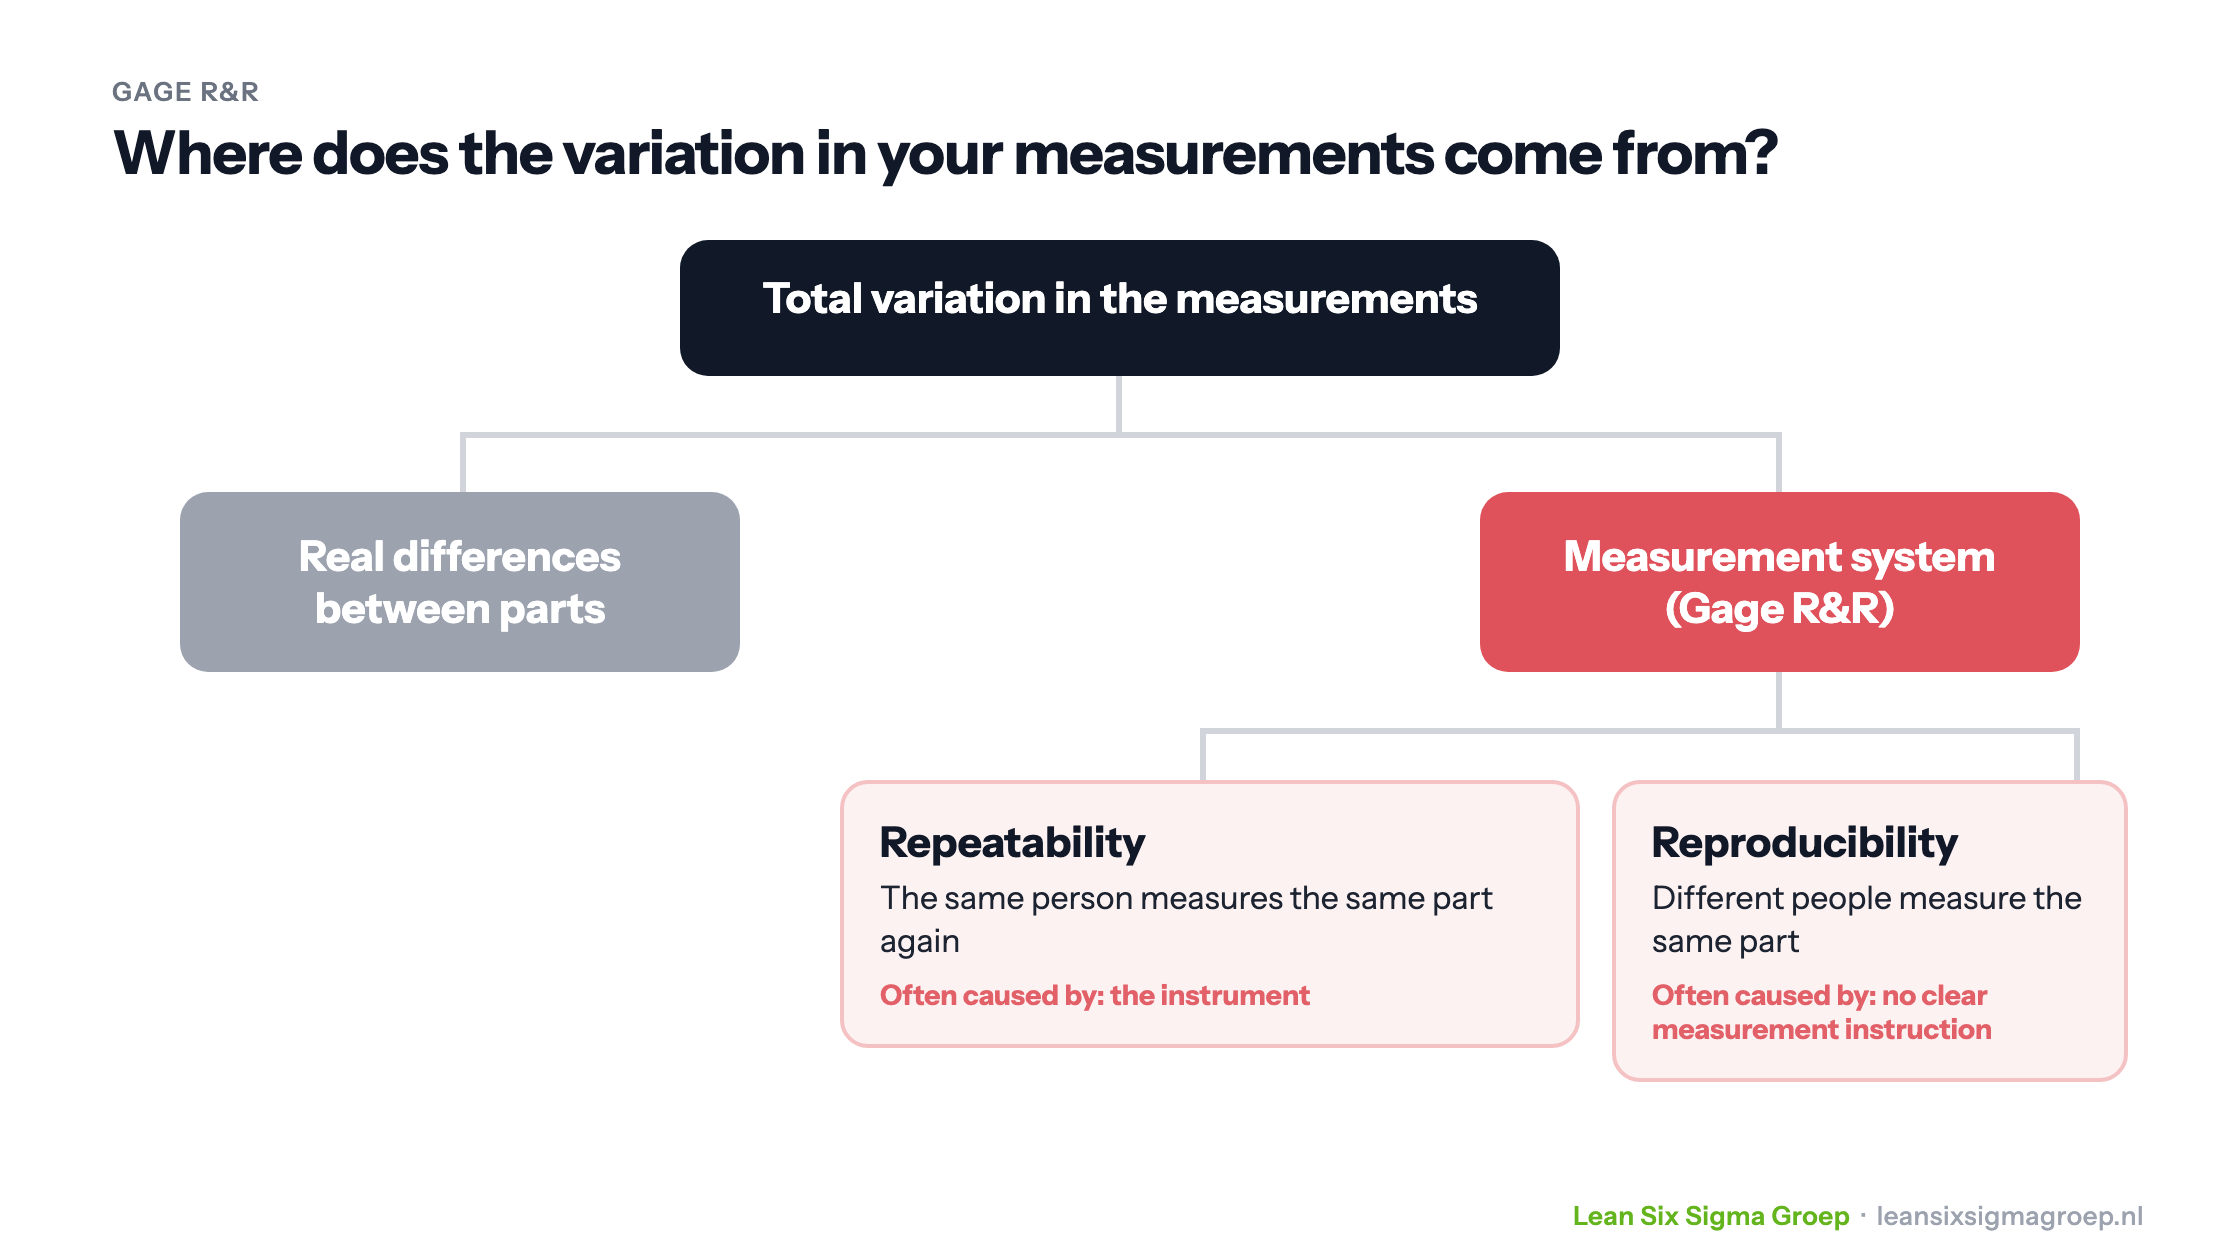
A Gage R&R is a study of the precision of a measurement system. It shows how much of the variation in your measurements comes from the measuring itself, rather than from real differences between parts. In Lean Six Sigma you do such a study before collecting data about your process. Otherwise you risk drawing the wrong conclusions from your data.
What does Gage R&R mean?
- Gage means measuring instrument.
- R&R stands for Repeatability and Reproducibility.
Precision is about two questions, shown in the image at the top of this article:
- Repeatability: does the measurement system give the same result when the same person measures the same part several times?
- Reproducibility: do different people get the same result when they measure the same part?
A Gage R&R is about precision, the spread of measurements. Whether measurements are right on average, accuracy, you examine separately by looking at bias, linearity and stability. Together this is called a measurement system analysis.
How to carry out a Gage R&R
- Choose a number of parts that together show the normal variation in the process, for example 10.
- Have 2 or 3 operators who normally measure measure each part several times, for example 2 or 3 times, in random order and without seeing earlier results.
- Analyse the results with a statistics package such as Minitab. It calculates what share of the total variation comes from the measurement system, and how much of that comes from repeatability and from reproducibility.
This is called a crossed Gage R&R: every operator measures every part. If a part can only be measured once, for example in a destructive test, you use a nested variant.
When is the measurement system good enough?
In the Black Belt training you go into this in more depth, with statistical analysis.
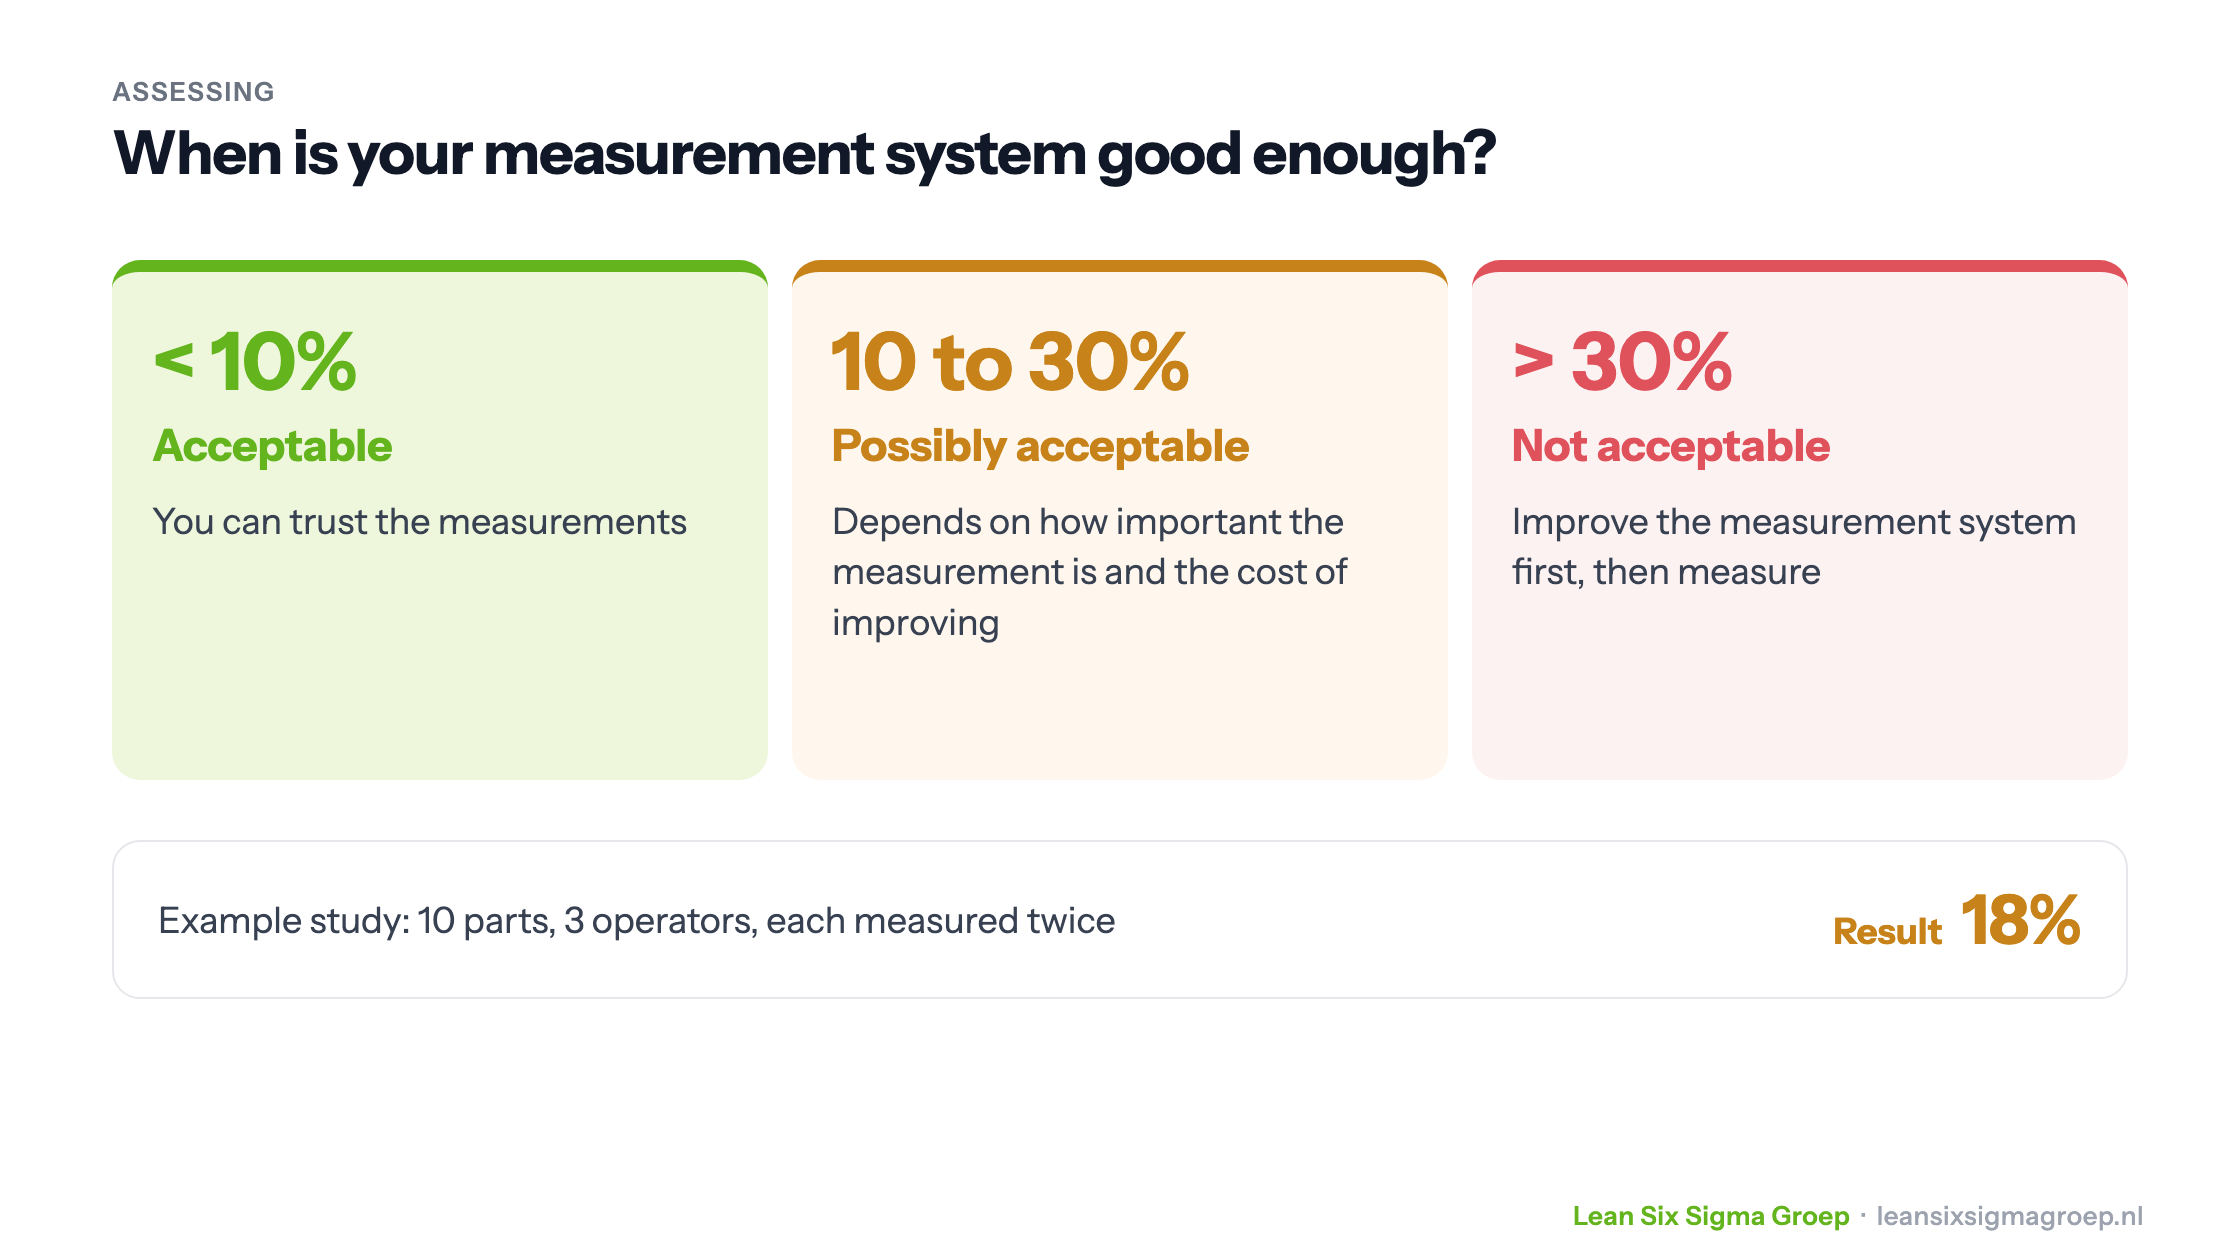
As a rule of thumb, based on the guidelines of the American automotive industry (AIAG), the share of total variation that comes from the measurement system should be:
- Below 10%: the measurement system is acceptable.
- Between 10% and 30%: possibly acceptable, depending on the importance of the measurement, the cost of the measurement system and of improvement, and process capability.
- Above 30%: the measurement system needs to be improved first.
Also look at the number of distinct categories that Minitab reports: it shows how many groups the measurement system can reliably distinguish between. Five or more is good.
Result too high? Find the cause
If the Gage R&R percentage is too high, first find and fix the cause before you start measuring for real.
High repeatability variation (spread when the same person measures again) is often caused by:
- the instrument: it needs maintenance, is unstable or not precise enough;
- the conditions: poor lighting, noise, vibration or temperature.
High reproducibility variation (differences between people) is often caused by:
- the method: there is no clear measurement instruction, everyone measures differently;
- the people: they are not sufficiently trained in using the instrument.
Gage R&R and the rest of measurement system analysis are covered in depth in the Green Belt training course.