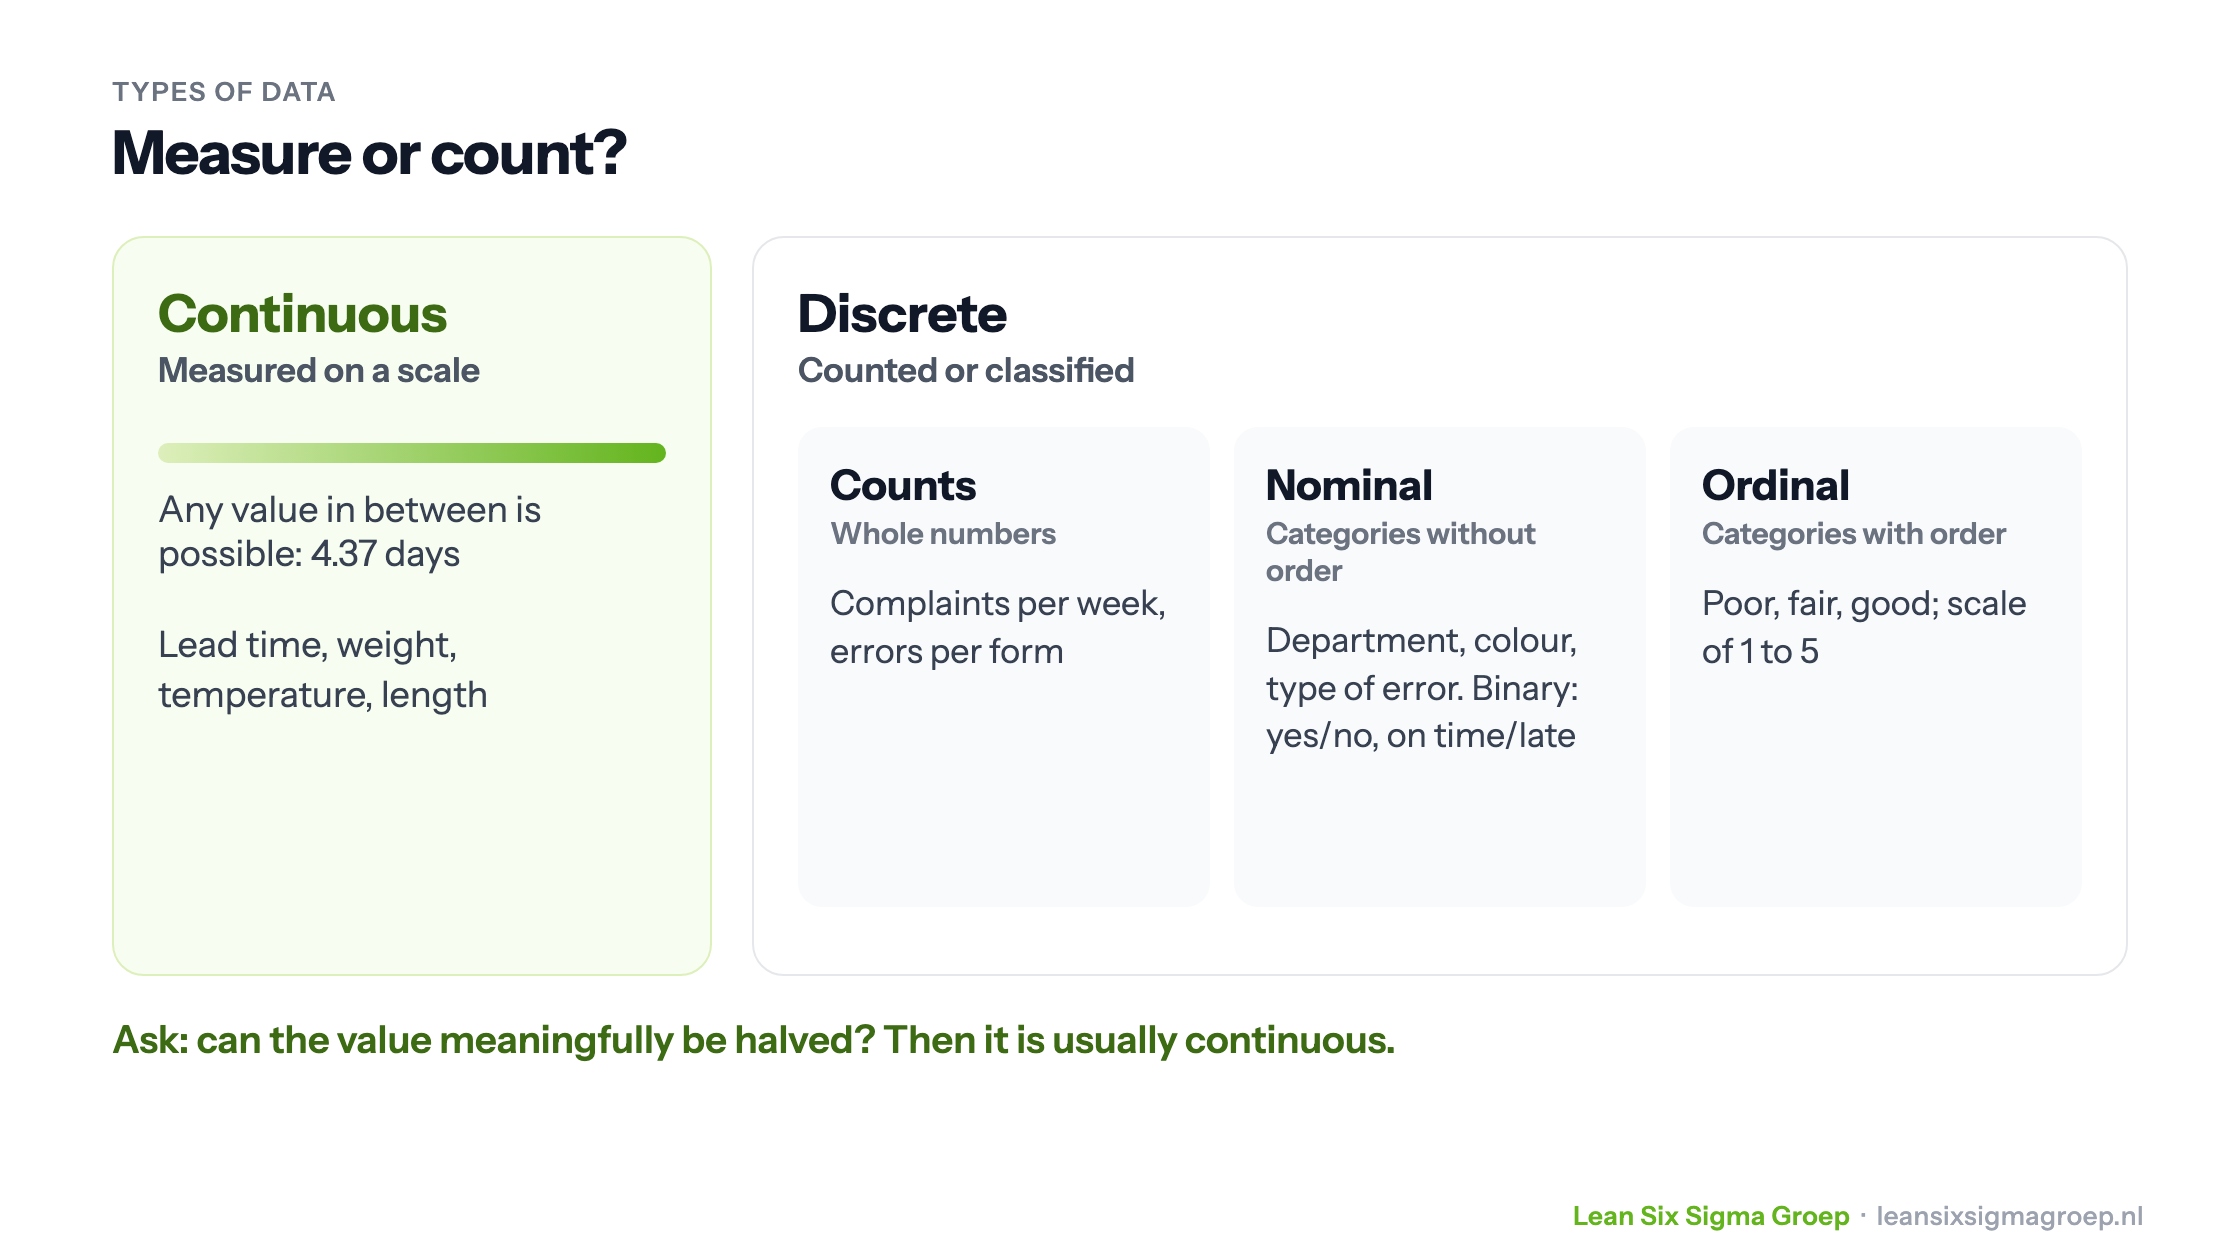
Data in an improvement project is either continuous or discrete. Continuous data is measured on a scale, such as time or weight. Discrete data is counted or classified into categories, such as the number of complaints or “on time / late”. The difference determines which analyses you can do and how much data you need.
Why the type of data matters
When you collect data in a Lean Six Sigma project, you first want to know what type of data you are working with. It determines which charts and tests you can use, and how large your sample must be to draw reliable conclusions. The image at the top of this article shows the classification.
Continuous data
Continuous data can take any value within a range, including all values in between. A lead time can be 4 days, but also 4.37 days. How precisely you measure depends only on your measuring instrument. You can calculate with continuous data: an average and a standard deviation really mean something.
Examples:
- Time: lead time, waiting time, processing time
- Weight: of a product, patient or material
- Length and dimensions: in metres, centimetres or millimetres
- Temperature and speed
- Amounts of money: the cost of an order, the amount of an invoice
Discrete data
Discrete data consists of separate values, with nothing in between. There are three kinds:
- Counts: whole numbers you count, such as the number of complaints per week or errors per form. Half a complaint doesn’t exist.
- Nominal data: categories without order, such as department, colour or type of error. Binary data also falls under this: data with only two possible values, such as yes/no, right/wrong or on time/late.
- Ordinal data: categories with a fixed order, but without a fixed distance between them. For example poor, fair, good, or a scale of 1 to 5 in a customer satisfaction survey. The categories of the Net Promoter Score (detractor, passive, promoter) are also ordinal.
In doubt? Ask yourself whether the value can meaningfully be halved. A lead time of 3 hours can be halved; a complaint or a category can’t.
How large should the sample be?
If you can’t measure everything, you take a sample. How large it must be depends on the type of data and on what you want to know: the location (for example the average) or the spread (for example the standard deviation). The image below shows the rule of thumb, using an example: the same delivery process, measured in two ways.
This is one of the tools you learn to apply in the Green Belt training.
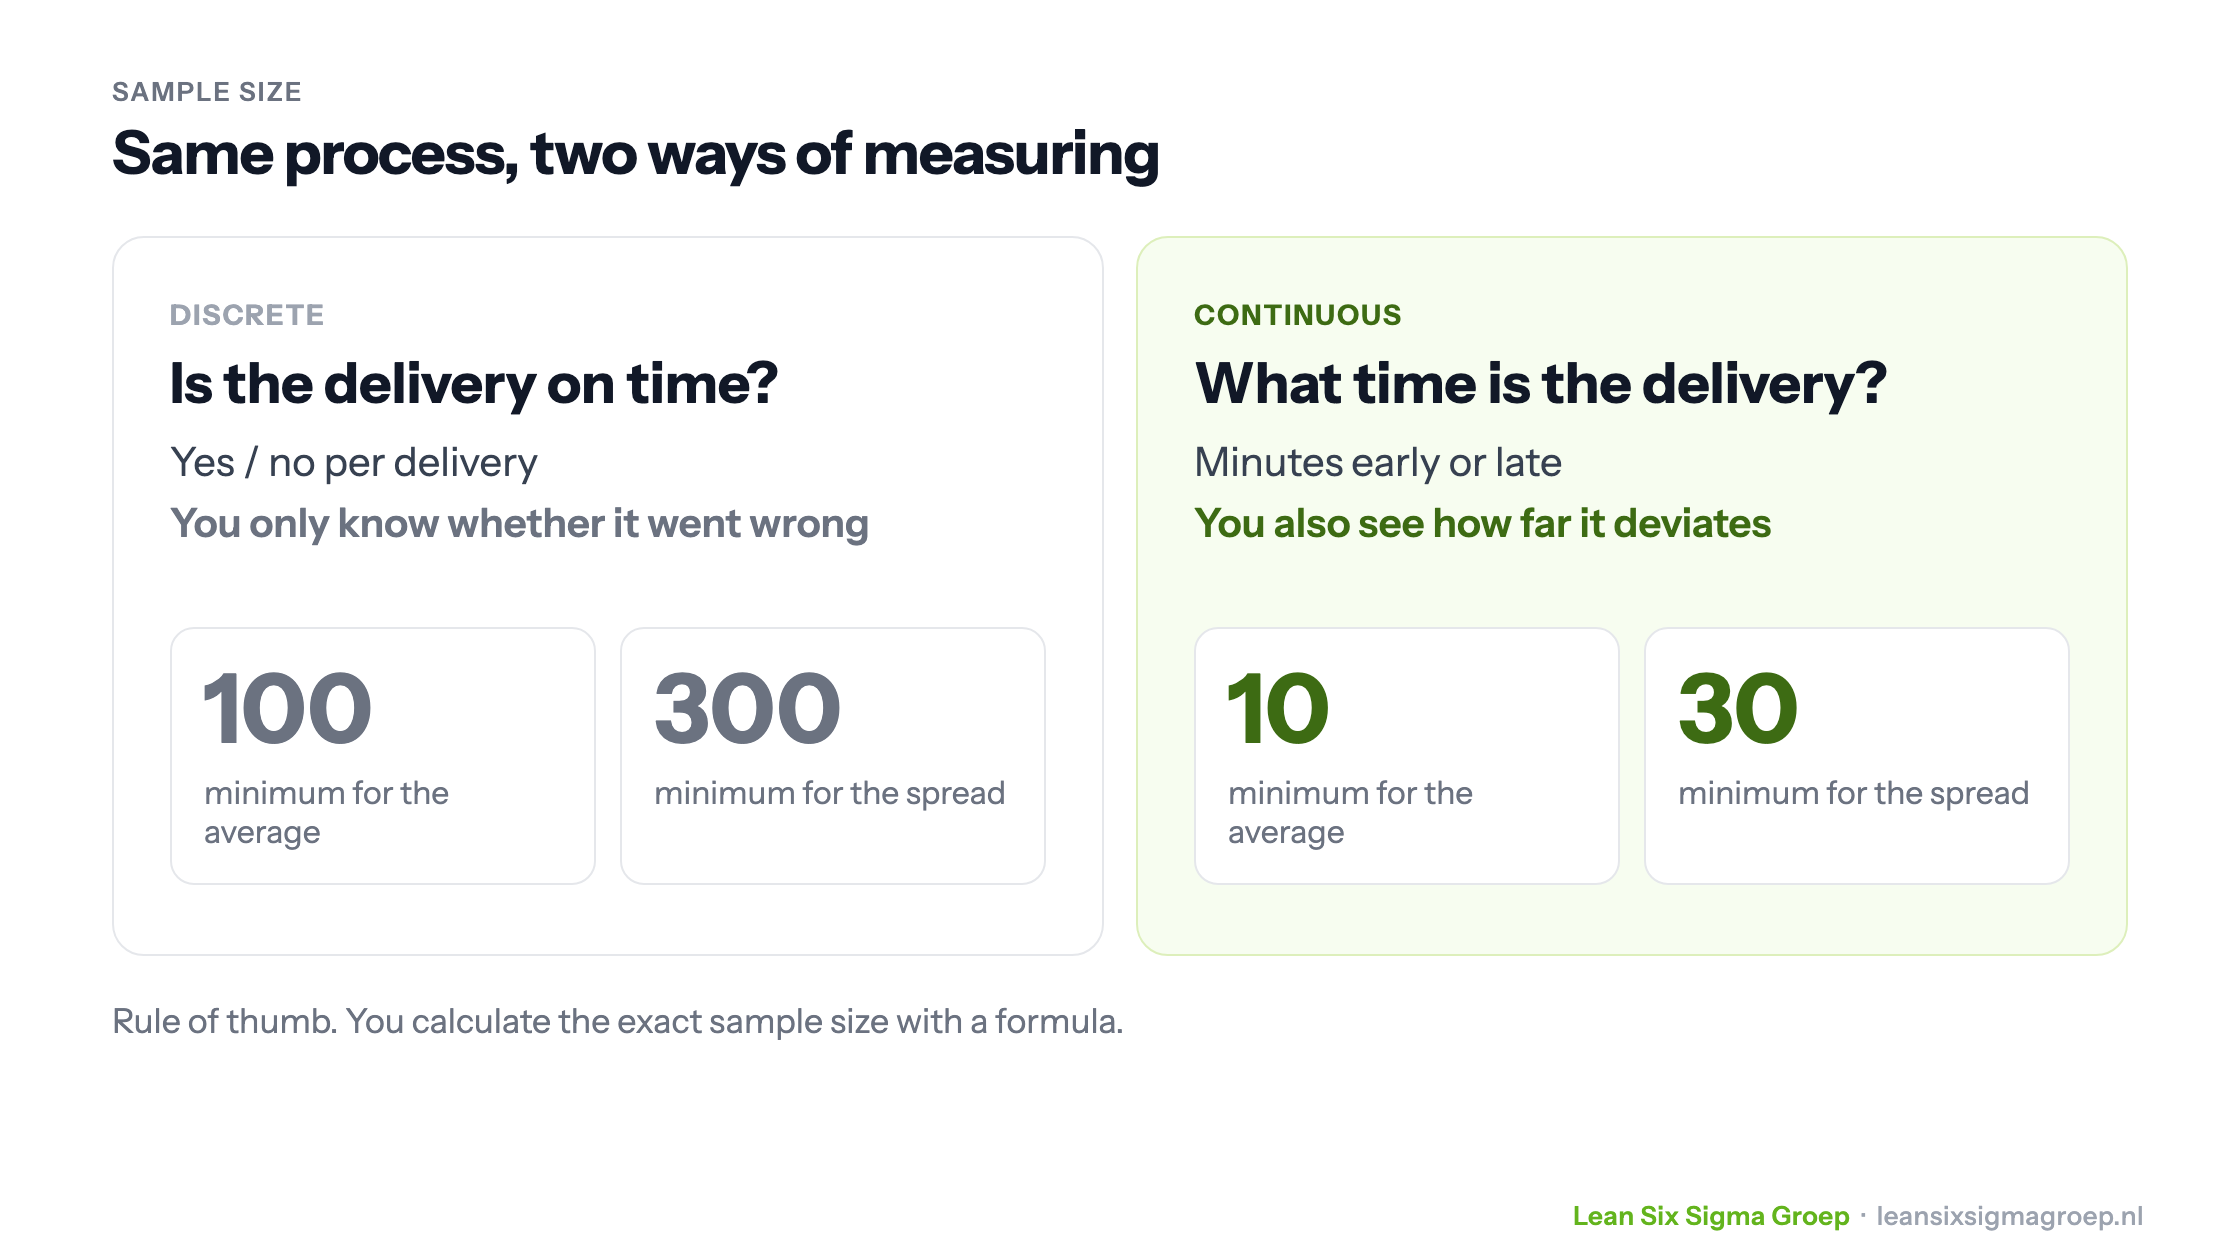
As a minimum: for discrete data, 100 data points to determine the location and 300 for the spread; for continuous data, 10 and 30. Continuous data contains much more information per measurement. “On time” only says it went well; “12 minutes early” also says how much margin there was.
So where possible, it pays to measure continuously. For example, record the actual delivery time rather than just whether the delivery was on time. You can always convert continuous data to discrete later, but not the other way round.
You calculate the exact sample size with formulas that take the desired precision and confidence into account. You learn that in the Black Belt training course.
Common mistakes
- Treating ordinal data as continuous. An average of 3.4 on a scale of 1 to 5 suggests a precision that isn’t there: the distance between “poor” and “fair” needn’t equal that between “fair” and “good”.
- A sample that is too small. With discrete data in particular you quickly fall short, because each measurement contains little information.
- Measuring discretely when you needn’t. Recording only “on time / late” throws away information that was already available.
- Measuring for too short a period. Process outcomes vary; so measure over a period that includes both busy and quiet times.
Want to learn how to calculate samples exactly and apply data analysis in an improvement project? Take a look at the Black Belt training course.