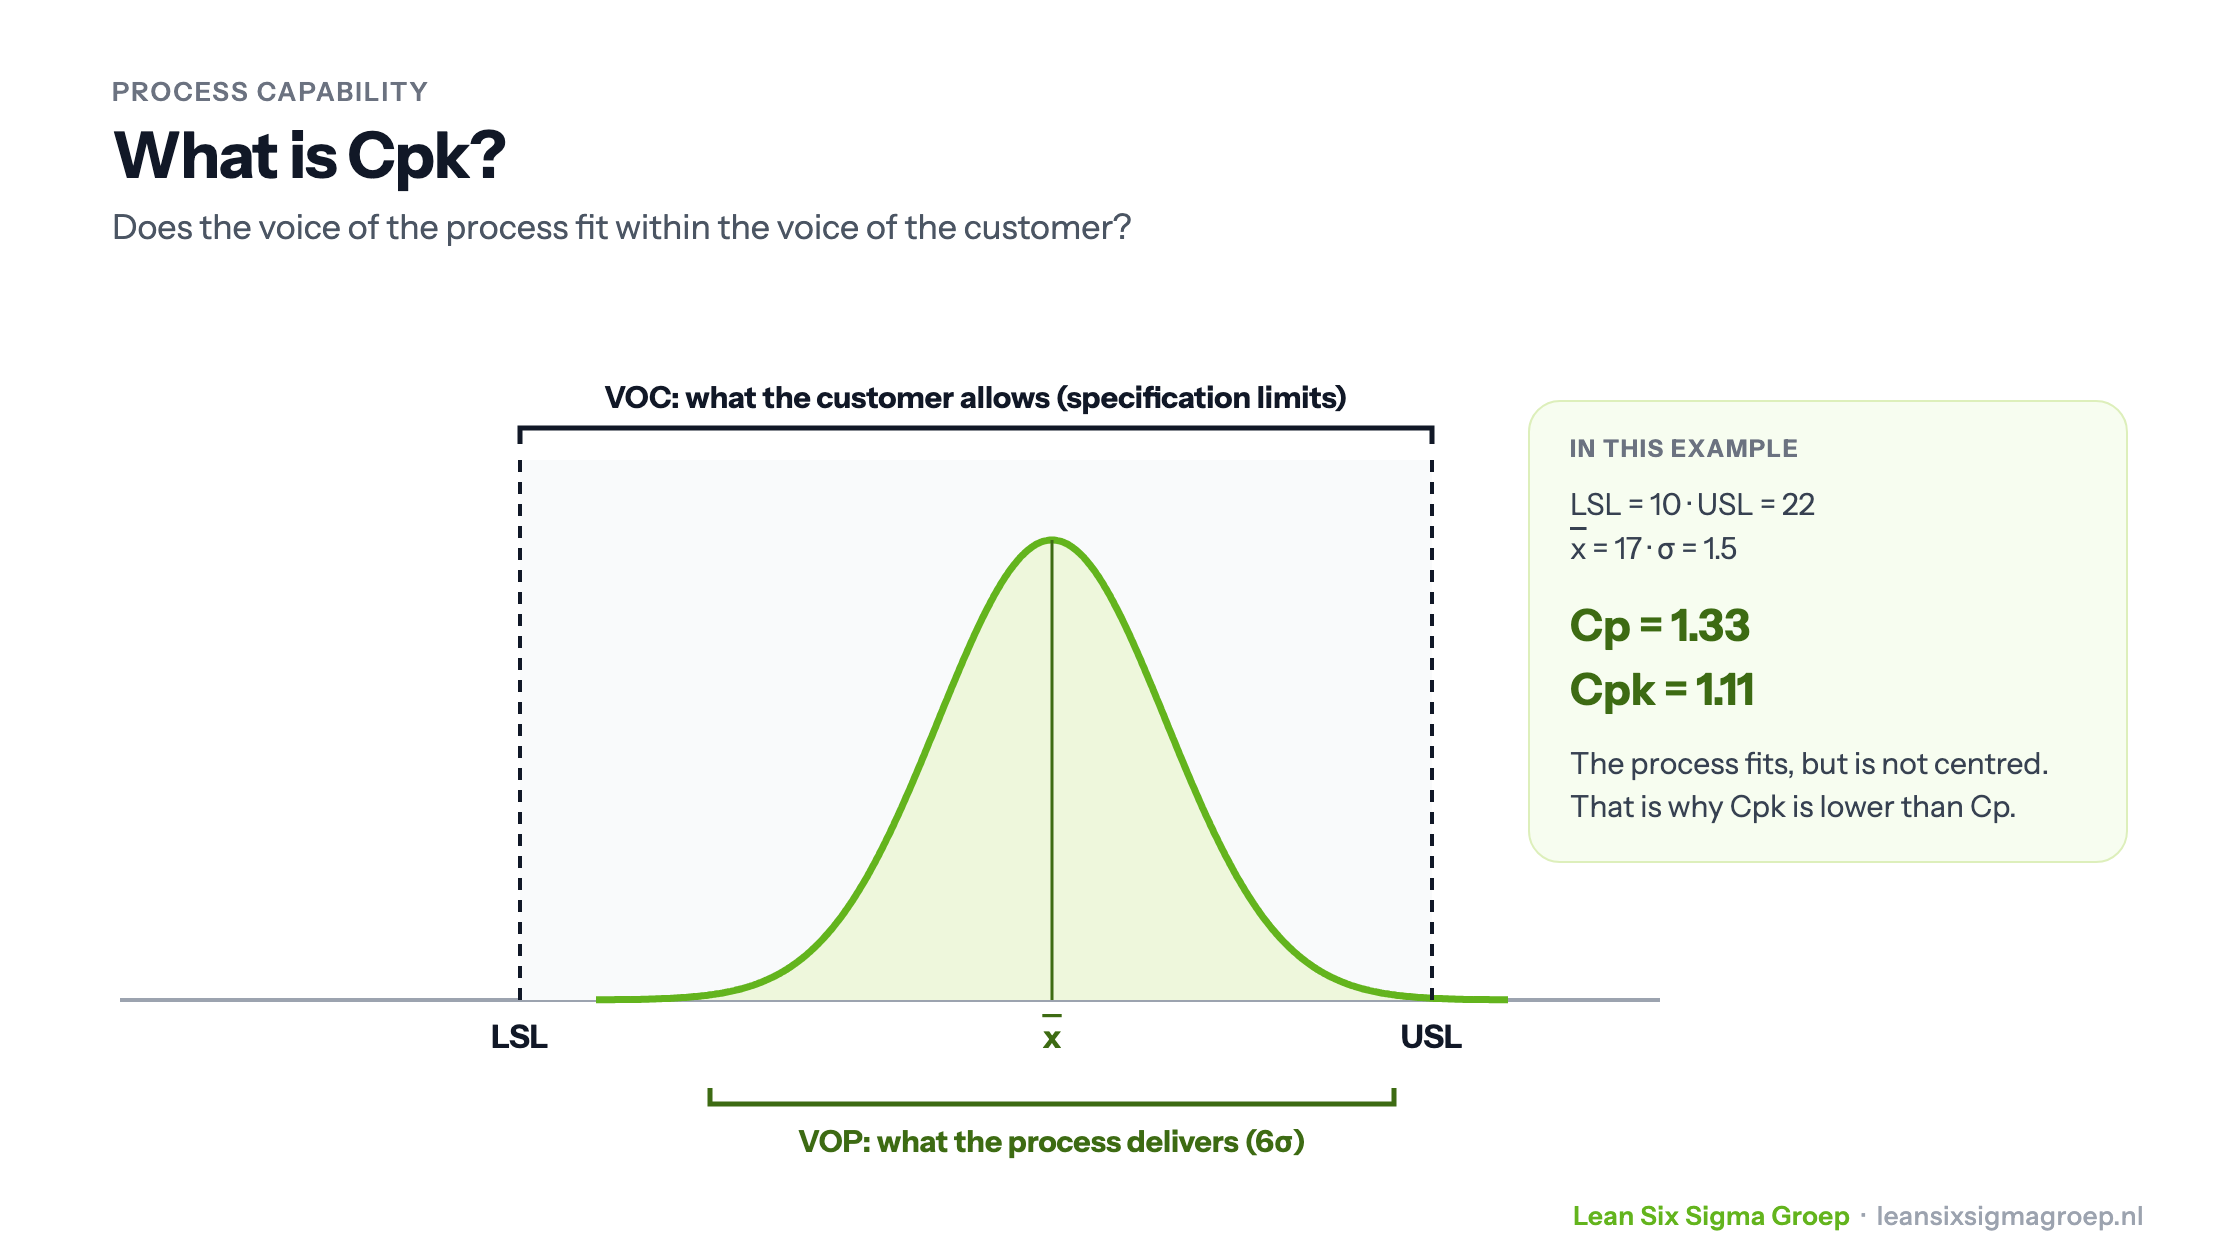
Cp stands for process capability. The k is usually explained as the Japanese ‘katayori’, which means deviation or offset. Cpk is an index that expresses the ratio between the distance from the process mean to the nearest specification limit and the process variation, expressed as three times the standard deviation.
The terms Cp and Cpk are used in process capability analysis, a key component of the Six Sigma methodology. A process capability analysis compares the current process with the requirements of the customer. How well is your process performing?
Cp and Cpk explained
We know the mean and the standard deviation as characteristics of process performance. Cp (capability of the process) looks at the spread within the process, the VOP (Voice of the Process), relative to the specification limits, the VOC (Voice of the Customer). In other words: is the process able to deliver what the customer wants?
The better the VOP fits within the VOC, the more capable the process is of meeting customer requirements.
To judge how good the process is, you compare process performance with the specification limits, also known as tolerance limits, that belong to the critical customer requirements (CTQs). A process is ‘capable’ when it meets the customer’s specifications.
In the Black Belt training you go into this in more depth, with statistical analysis.
When you compare process performance with the specification limits, you can calculate a number of indices: the process capability indices. These show to what extent the process is able to meet the given specification limits.
The essence
The essence of every process capability index is that you ‘confront’ actual process performance with the specification limit(s) belonging to the critical customer requirements (CTQs). In practice, you look at how the (normal) distribution of process performance relates to the upper (USL) and/or lower (LSL) specification limit.
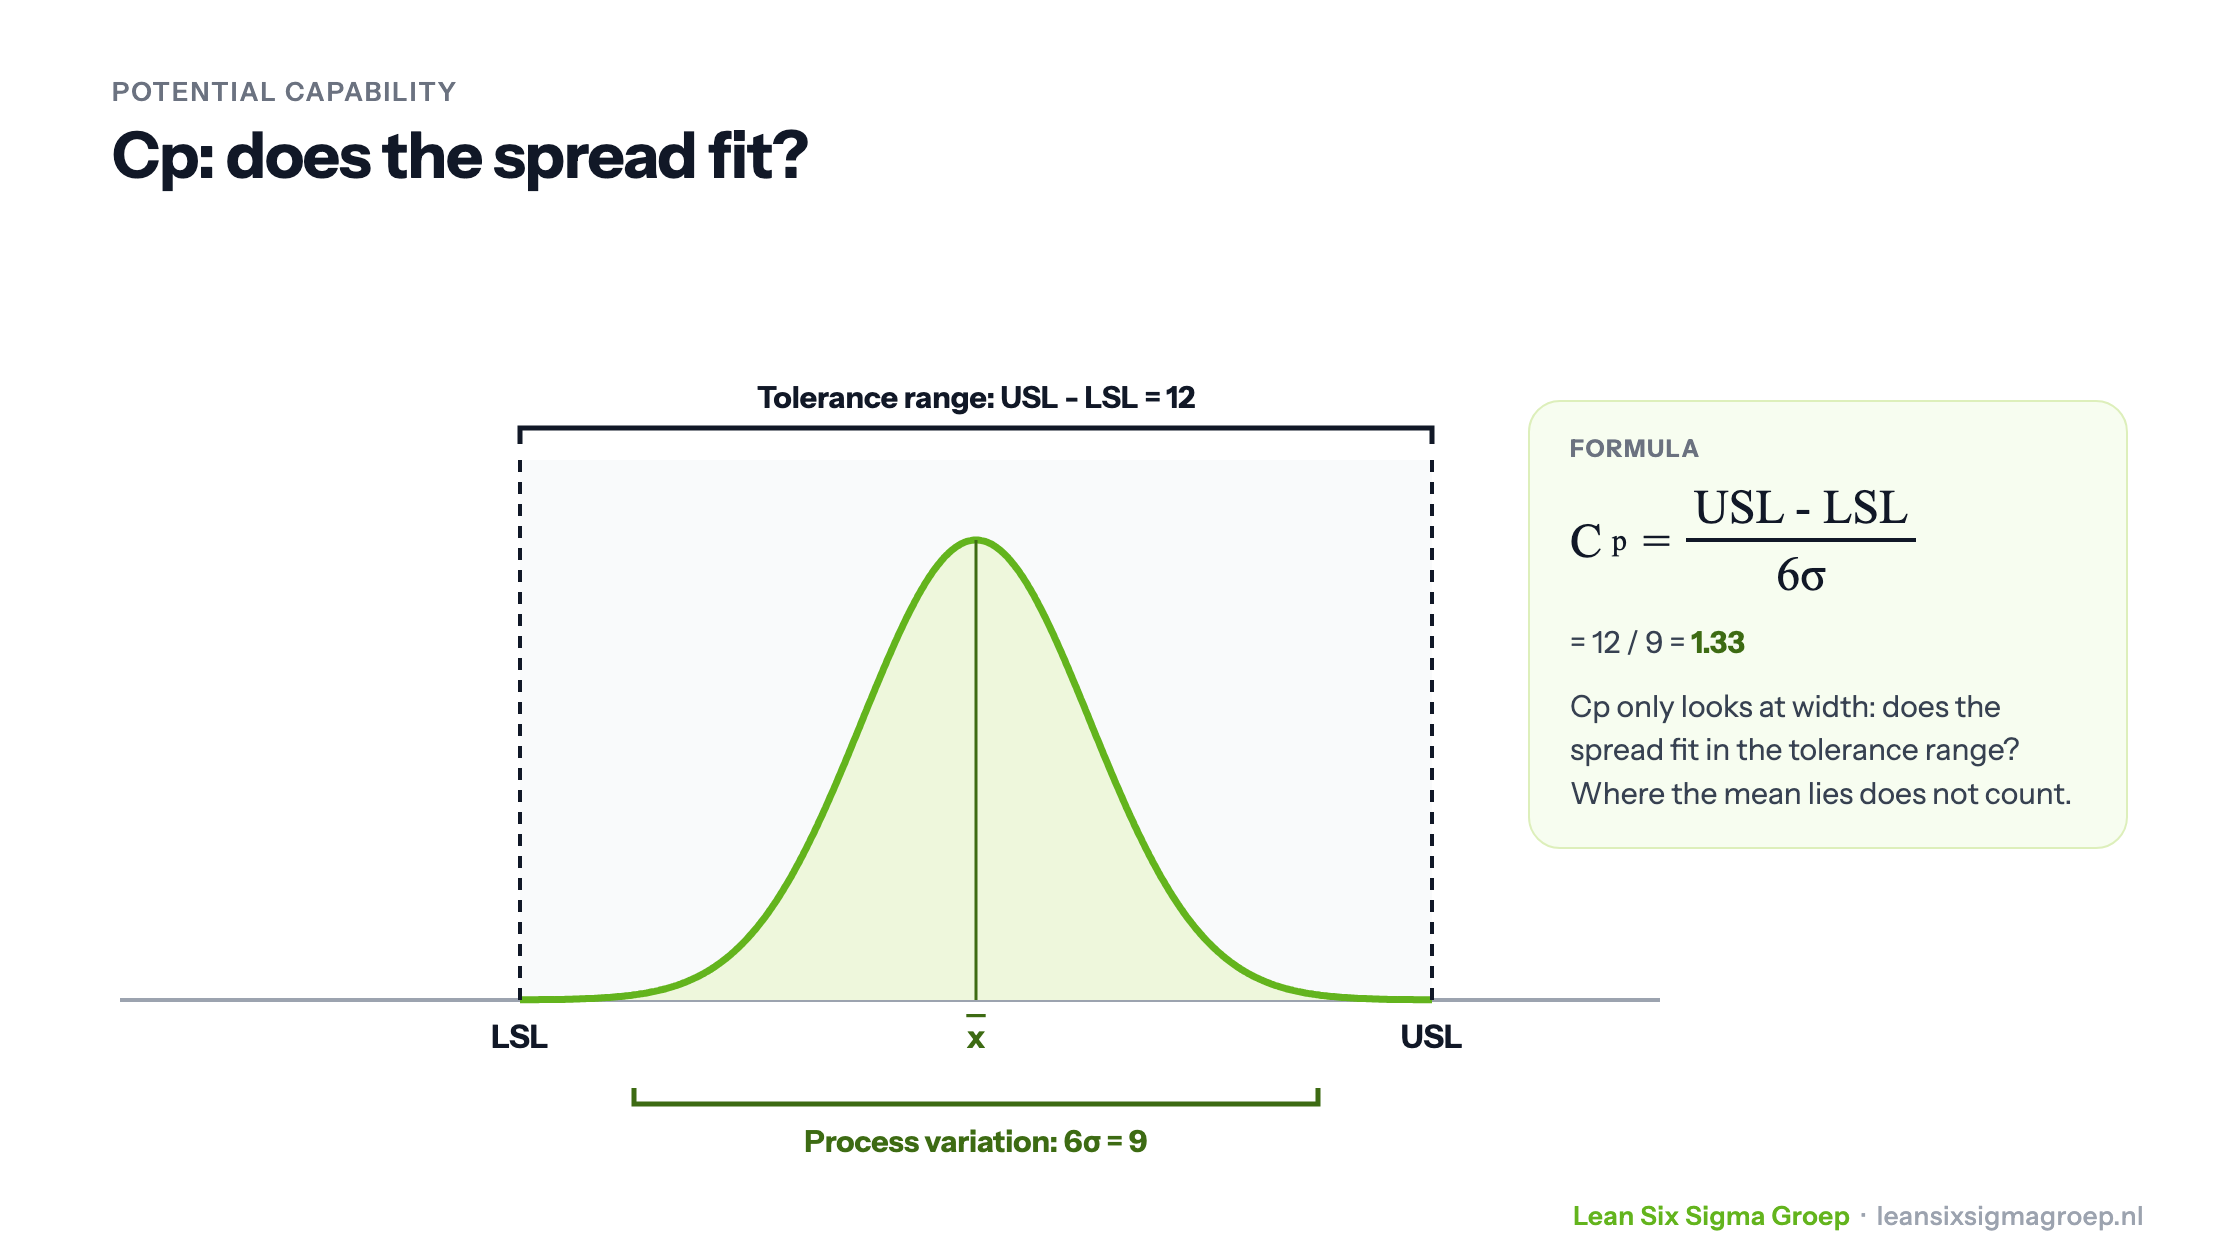
In the range between the LSL and the USL, a product meets the specifications. We call this range the tolerance range.
The process capability index Cp expresses the ratio between the tolerance range and the variation of the process, expressed as six times the standard deviation: Cp = (USL – LSL) / 6σ.
Cpk: actual process capability
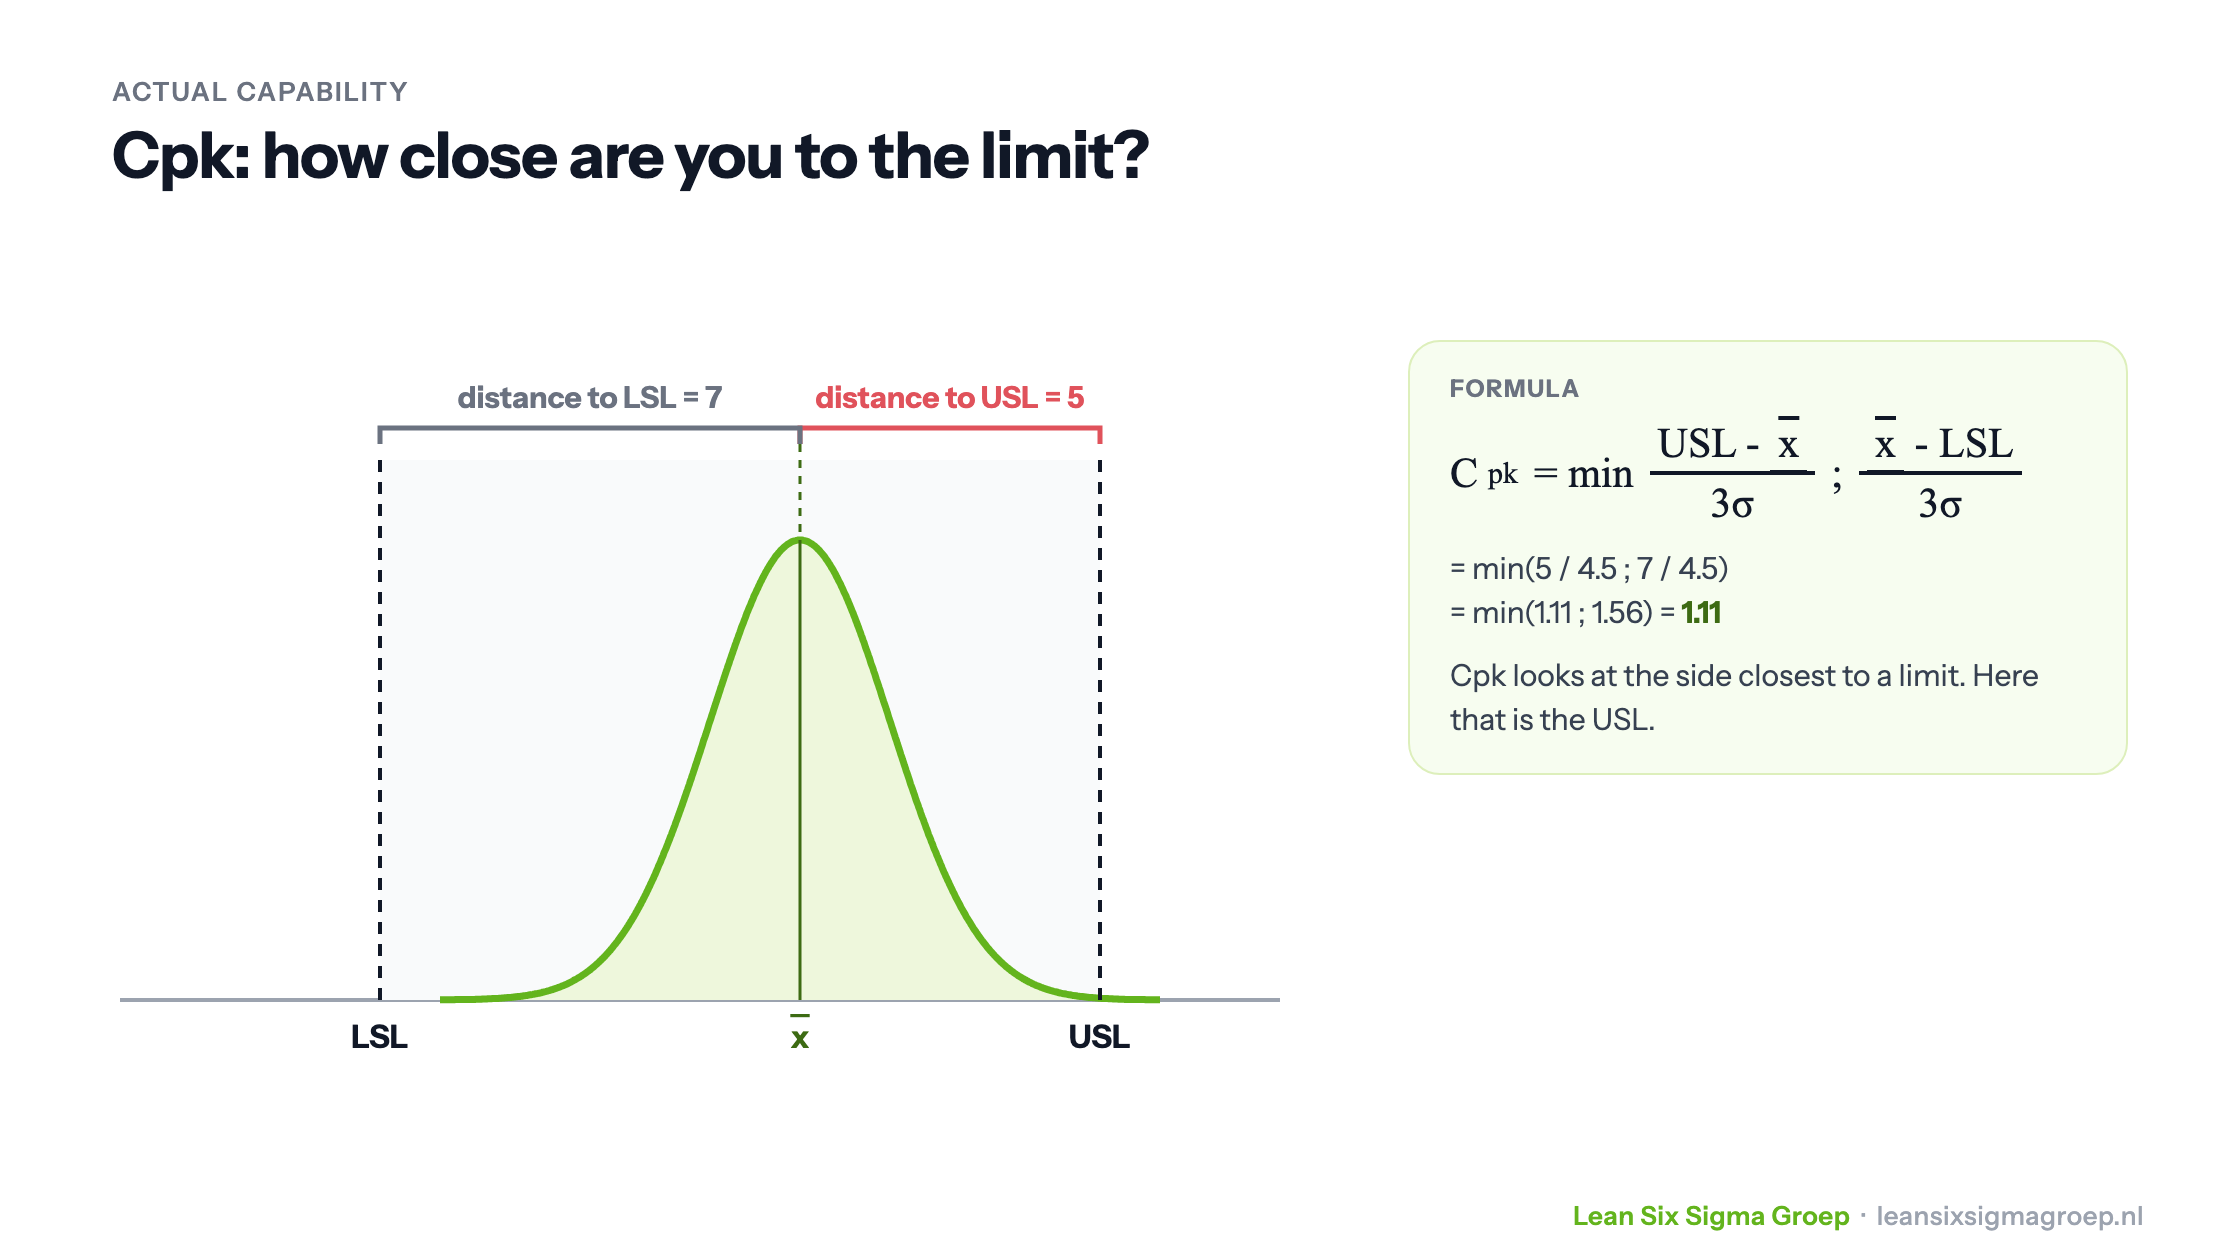
Cp says nothing about the actual number of products that fall outside the specification limit(s), because the distribution does not have to sit exactly in the middle of the tolerance range. That is why actual process capability matters more to the customer. The index that goes with it is Cpk.
Cpk expresses the ratio between the distance from the process mean to the nearest specification limit and the process variation, expressed as three times the standard deviation. When there is both an upper and a lower limit, you can calculate two distances between the mean and the specification limits.
You calculate both distances and take the smaller of the two (the minimum). That side is closest to the limit and so determines how much margin the process has.
Comparing Cp and Cpk
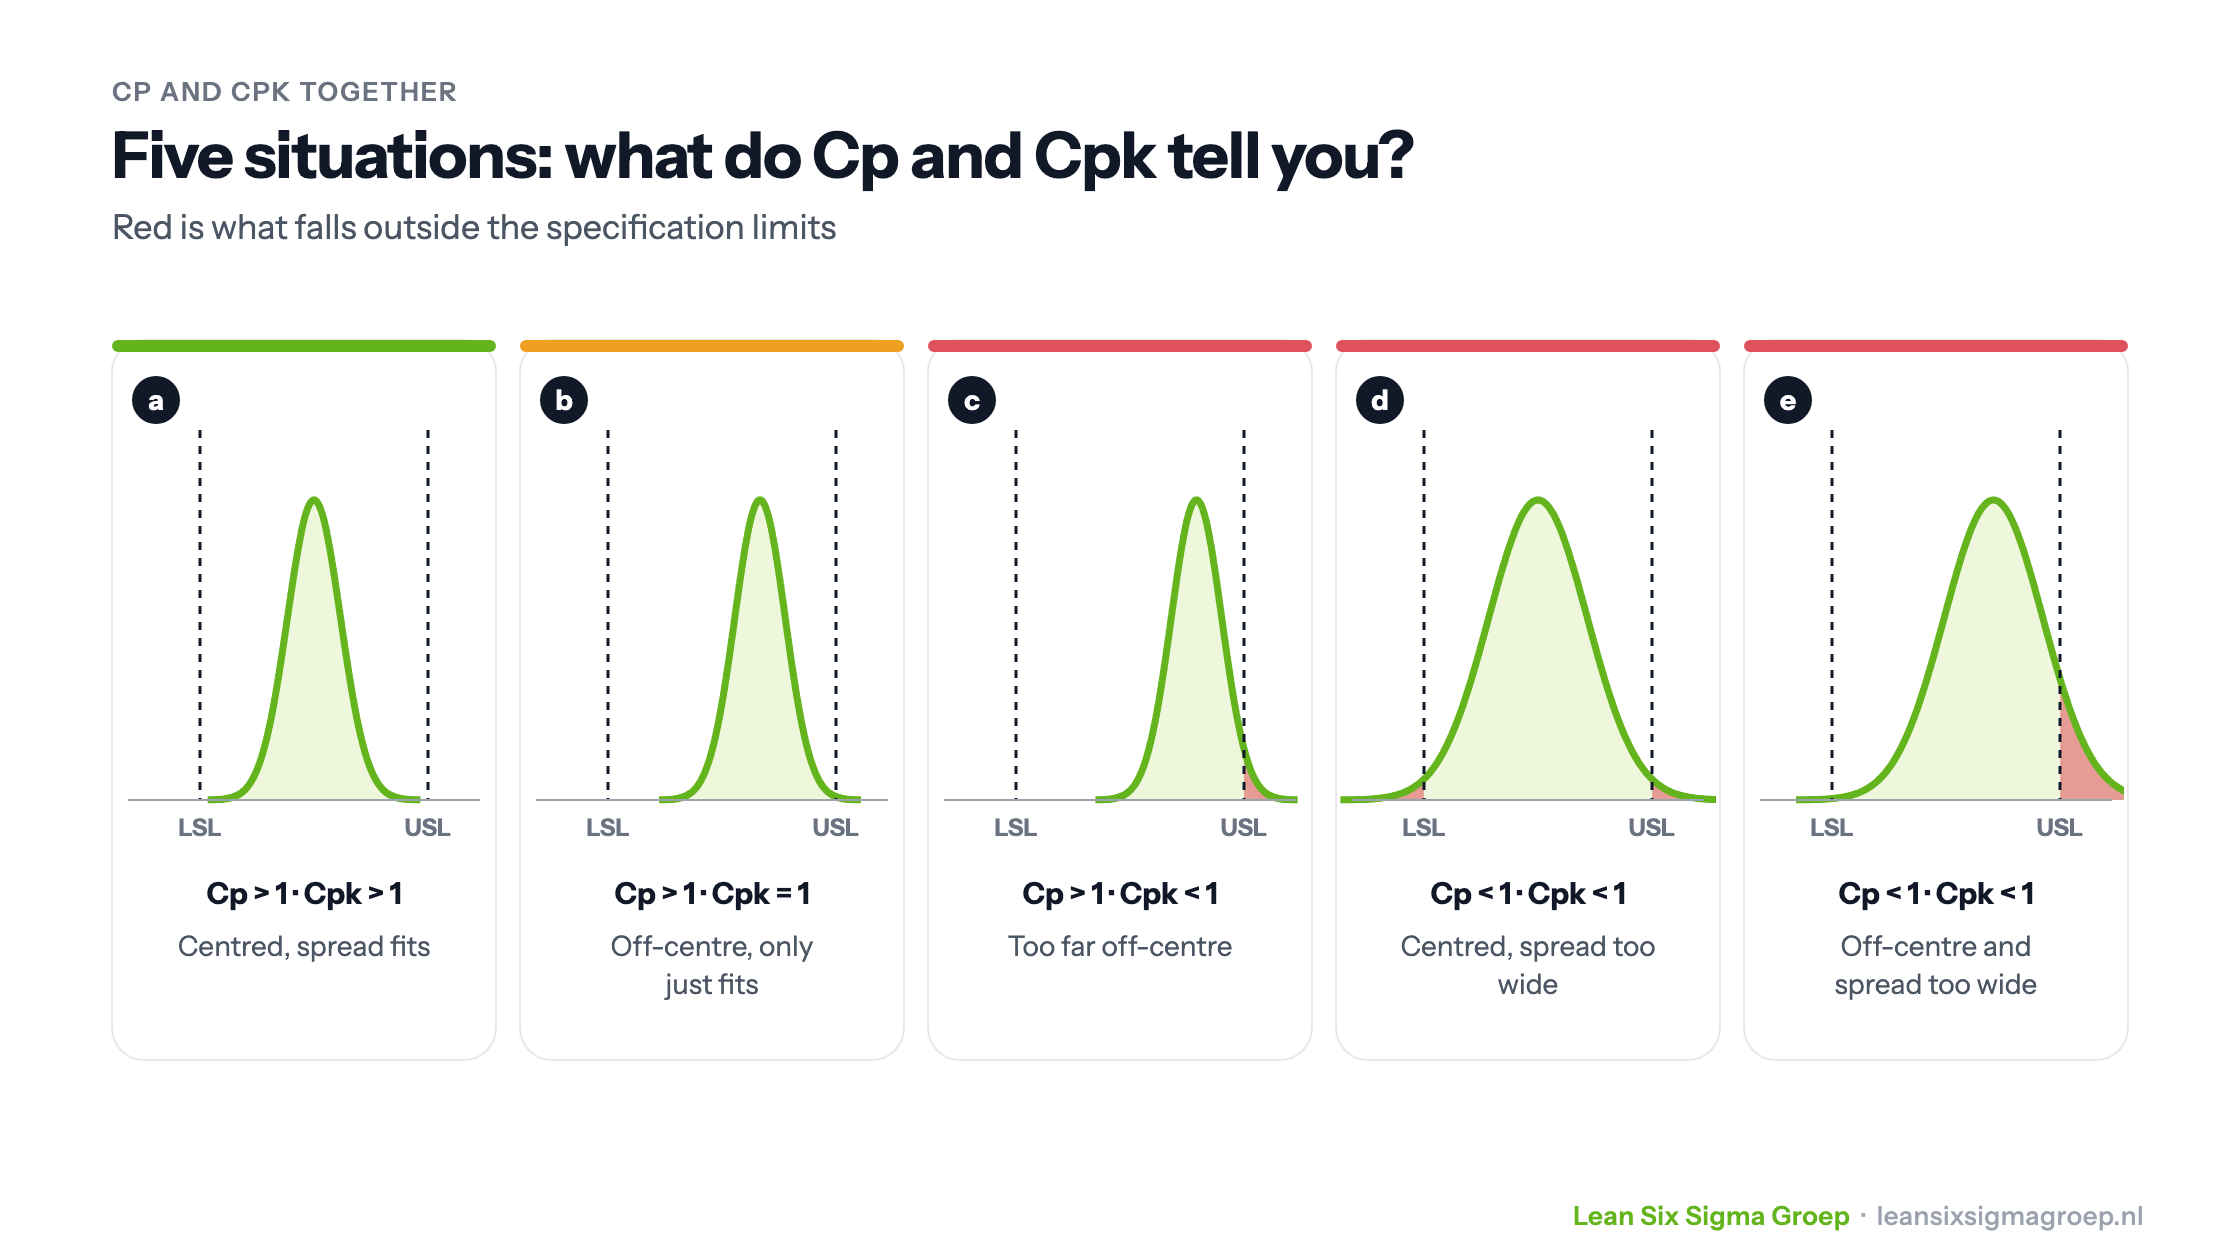
When the process mean lies exactly midway between the specification limits, Cp and Cpk are equal. When the mean is not in the middle of the tolerance range, the two indices start to differ and Cpk is always smaller than Cp. Cp is therefore the upper limit for Cpk.
In general, the higher the Cp and Cpk, the better the process performance. A rule of thumb is that Cp should be greater than 1.33.
With a Cpk below 1.0, part of the process output falls outside the specification limits. A Cpk of exactly 1.0 means that the nearest limit lies three standard deviations from the mean: the process only just fits, with no margin. The further Cpk is above 1.0, the more margin there is. In practice, a Cpk of at least 1.33 is often required.
With a Cpk of 2, the standard deviation fits six times between the mean and the nearest limit: a process at six sigma level. The well-known 3.4 defects per million opportunities (DPMO) assumes a long-term shift of the mean of 1.5 standard deviations. Without that shift, the number of defects is far smaller still.
Cpk and the sigma level
A high Cp is a necessary but not sufficient condition for a good sigma level. A high sigma level is only possible when the process is also well centred relative to the specification limits, and you can see that in a good Cpk.
To reach a sigma level of 6 (a ‘Six Sigma process’), Cp and Cpk must both be at least 2: the standard deviation then fits at least six times between the mean and the customer’s specification limits.