The median is the middle value of a set of numbers, when you put them in order. Half of the values lie below it, half above. Unlike the mean, the median is hardly affected by a few extreme values. That is why it is often a fairer measure of what is “typical”.
Median, mean and mode
Descriptive statistics has three well-known measures for the location of data, the “middle”:
- The mean: the sum of all values divided by the number of values.
- The median: the middle value when you sort all values.
- The mode: the value that occurs most often.
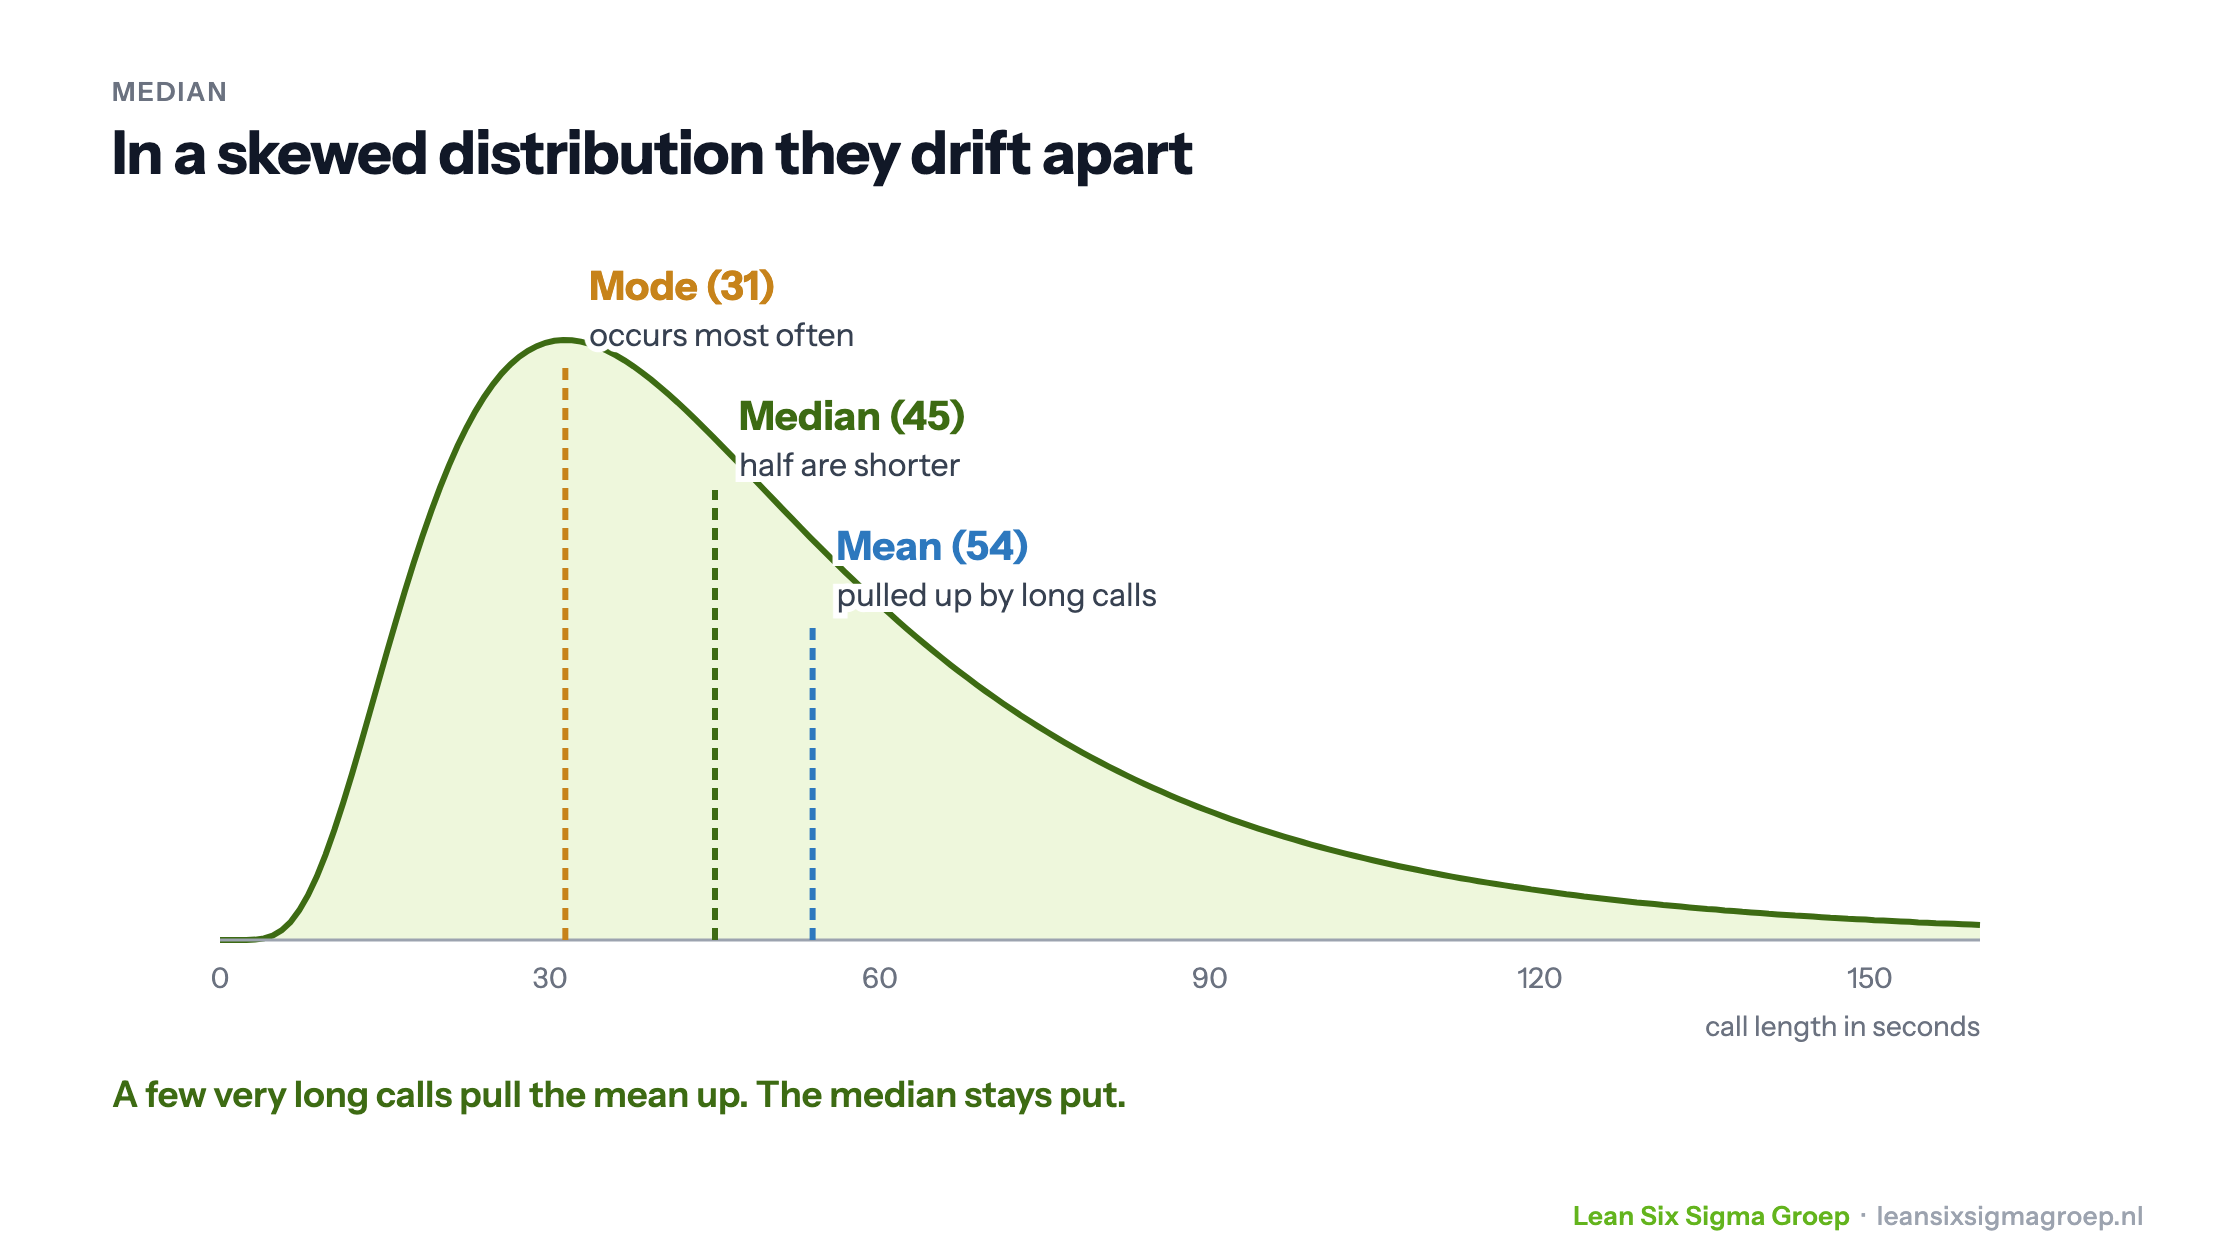
In a symmetrical distribution, such as the normal distribution, all three coincide in the middle. In a skewed distribution they drift apart, as shown in the image at the top of this article.
Take a call centre that has recorded the length of a thousand calls. Most calls are short, a few take very long. A few long calls pull the mean up to 54 seconds. The median stays at 45 seconds: half of the calls are shorter. If you want to know how long an ordinary call takes, the median tells you more.
When is the median better than the mean?
The mean is sensitive to outliers. A single extreme value can shift it considerably, so that it no longer gives a good picture of most values. The median is much less sensitive to this. That makes it the better choice for skewed distributions and for data with outliers, such as lead times, incomes or house prices.
An example. You want to know what a freelance Scrum Master earns, and ask five Scrum Masters in your network for their hourly rate: €60, €65, €70, €80 and €85. The mean is €72, the median €70. They are close together.
Then you speak to two experienced Scrum Masters working for a start-up in New York, at €300 an hour. The series becomes: €60, €65, €70, €80, €85, €300 and €300.
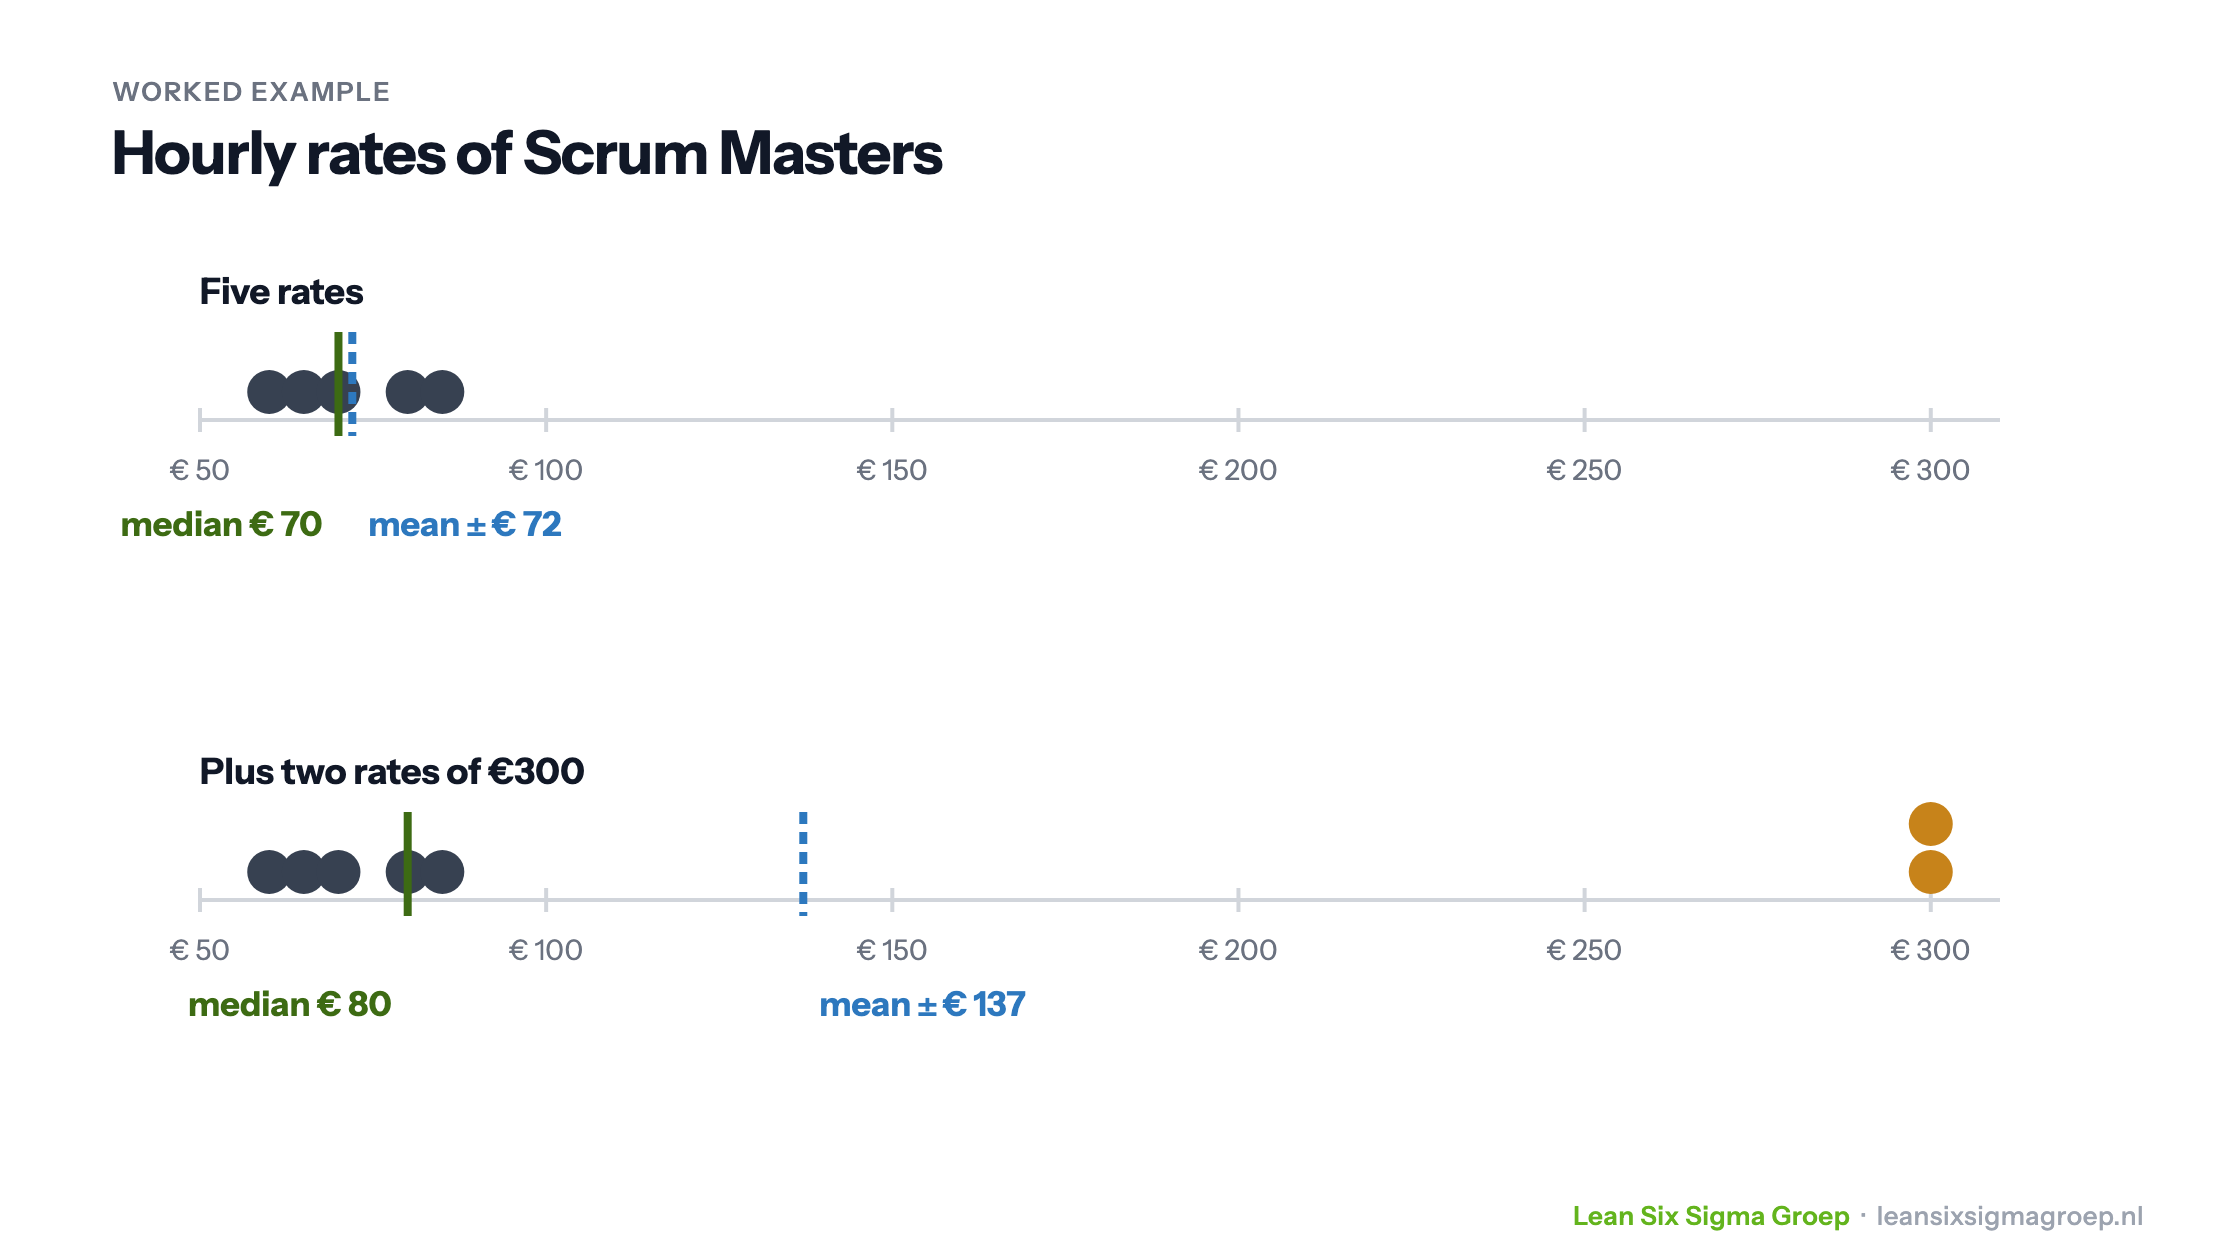
The mean shoots up to about €137, while five of the seven Scrum Masters charge under €90. The median shifts only a little, to €80, and gives a much better picture of what an ordinary Scrum Master charges.
Calculating the median
- Put the values in order, from low to high.
- With an odd number, the median is the middle value. With 7 values, it is the fourth.
- With an even number, there is no middle value. Then you take the mean of the two middle ones. With €60, €65, €70, €80, €85 and €300 those are €70 and €80, so the median is €75.
In Excel you use the MEDIAN function.
Normally distributed or not?
The rule of thumb: if the data is roughly normally distributed, the mean is a good measure. If the data is skewed or contains outliers, the median often tells you more.
The normal distribution, the well-known bell curve, was described in 1733 by Abraham de Moivre. Carl Friedrich Gauss made it famous in 1809, which is why it is also called the Gaussian curve. In the nineteenth century the Belgian Adolphe Quetelet applied it to measurements of people, such as height. Many measurements are approximately normally distributed, such as body height or the measurement errors of an instrument. But far from everything: lead times, waiting times and incomes are almost always skewed.
The quickest way to see whether your data is normally distributed is a histogram or a box plot: is the distribution symmetrical around the middle, or does it have a long tail? Statistical software such as Minitab or SPSS can also test it with a normality test, such as the Anderson-Darling test. It gives a p-value: if it is below 0.05, the data is probably not normally distributed.
Want to learn which measure to use when, and how to analyse data in an improvement project? Take a look at the Green Belt training course.