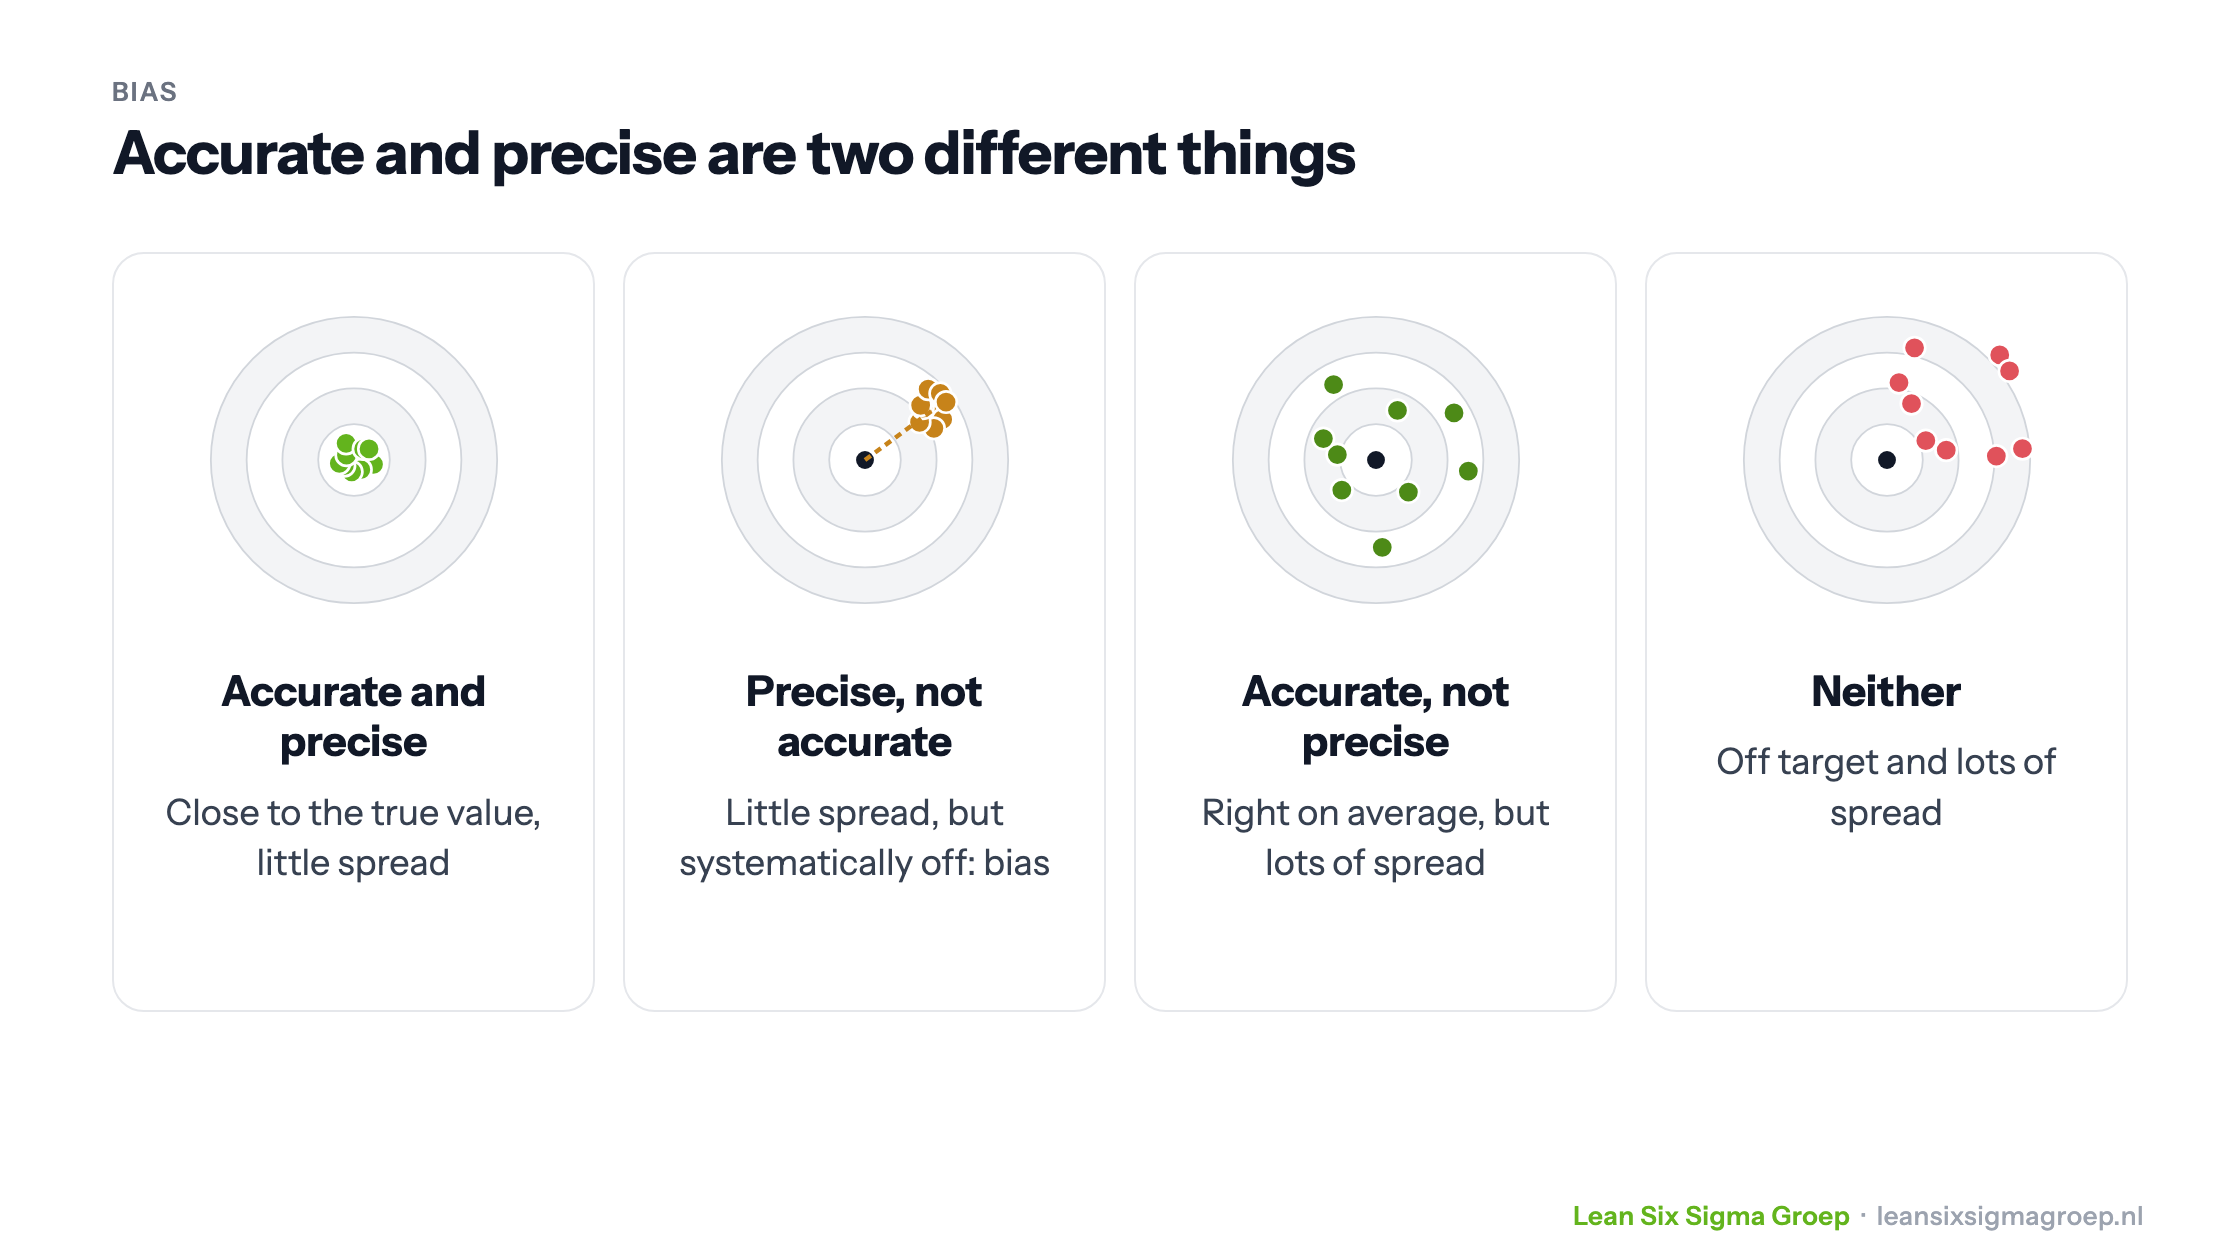
Bias is a systematic deviation: a measurement or study is consistently off from reality in the same direction. Think of scales that always show 3 kilos too much, or a survey filled in mainly by dissatisfied customers. The results then don’t give a true picture, and decisions based on them are wrong too.
Bias in a measurement system
In an improvement project you want to base decisions on reliable data. That is why Six Sigma first checks whether the measurement system is sound, with a measurement system analysis. If the measurement system isn’t right, your data shows deviations or spread that don’t exist in reality.
Errors in a measurement system can come from the measuring instrument itself, such as badly calibrated scales, or from the people measuring, for example when everyone does it differently. Two things matter here, shown at the top of this article: accuracy and precision.
- Accuracy is about location: is the measurement right on average? A fixed, systematic shift is called bias. An example is scales that always show 3 kilos too much.
- Precision is about spread: are repeated measurements close together? An example: lead time is measured from the request one time and from the start of work another time.
A measurement can be precise but not accurate (all measurements close together, but off target), or the other way round. You need both.
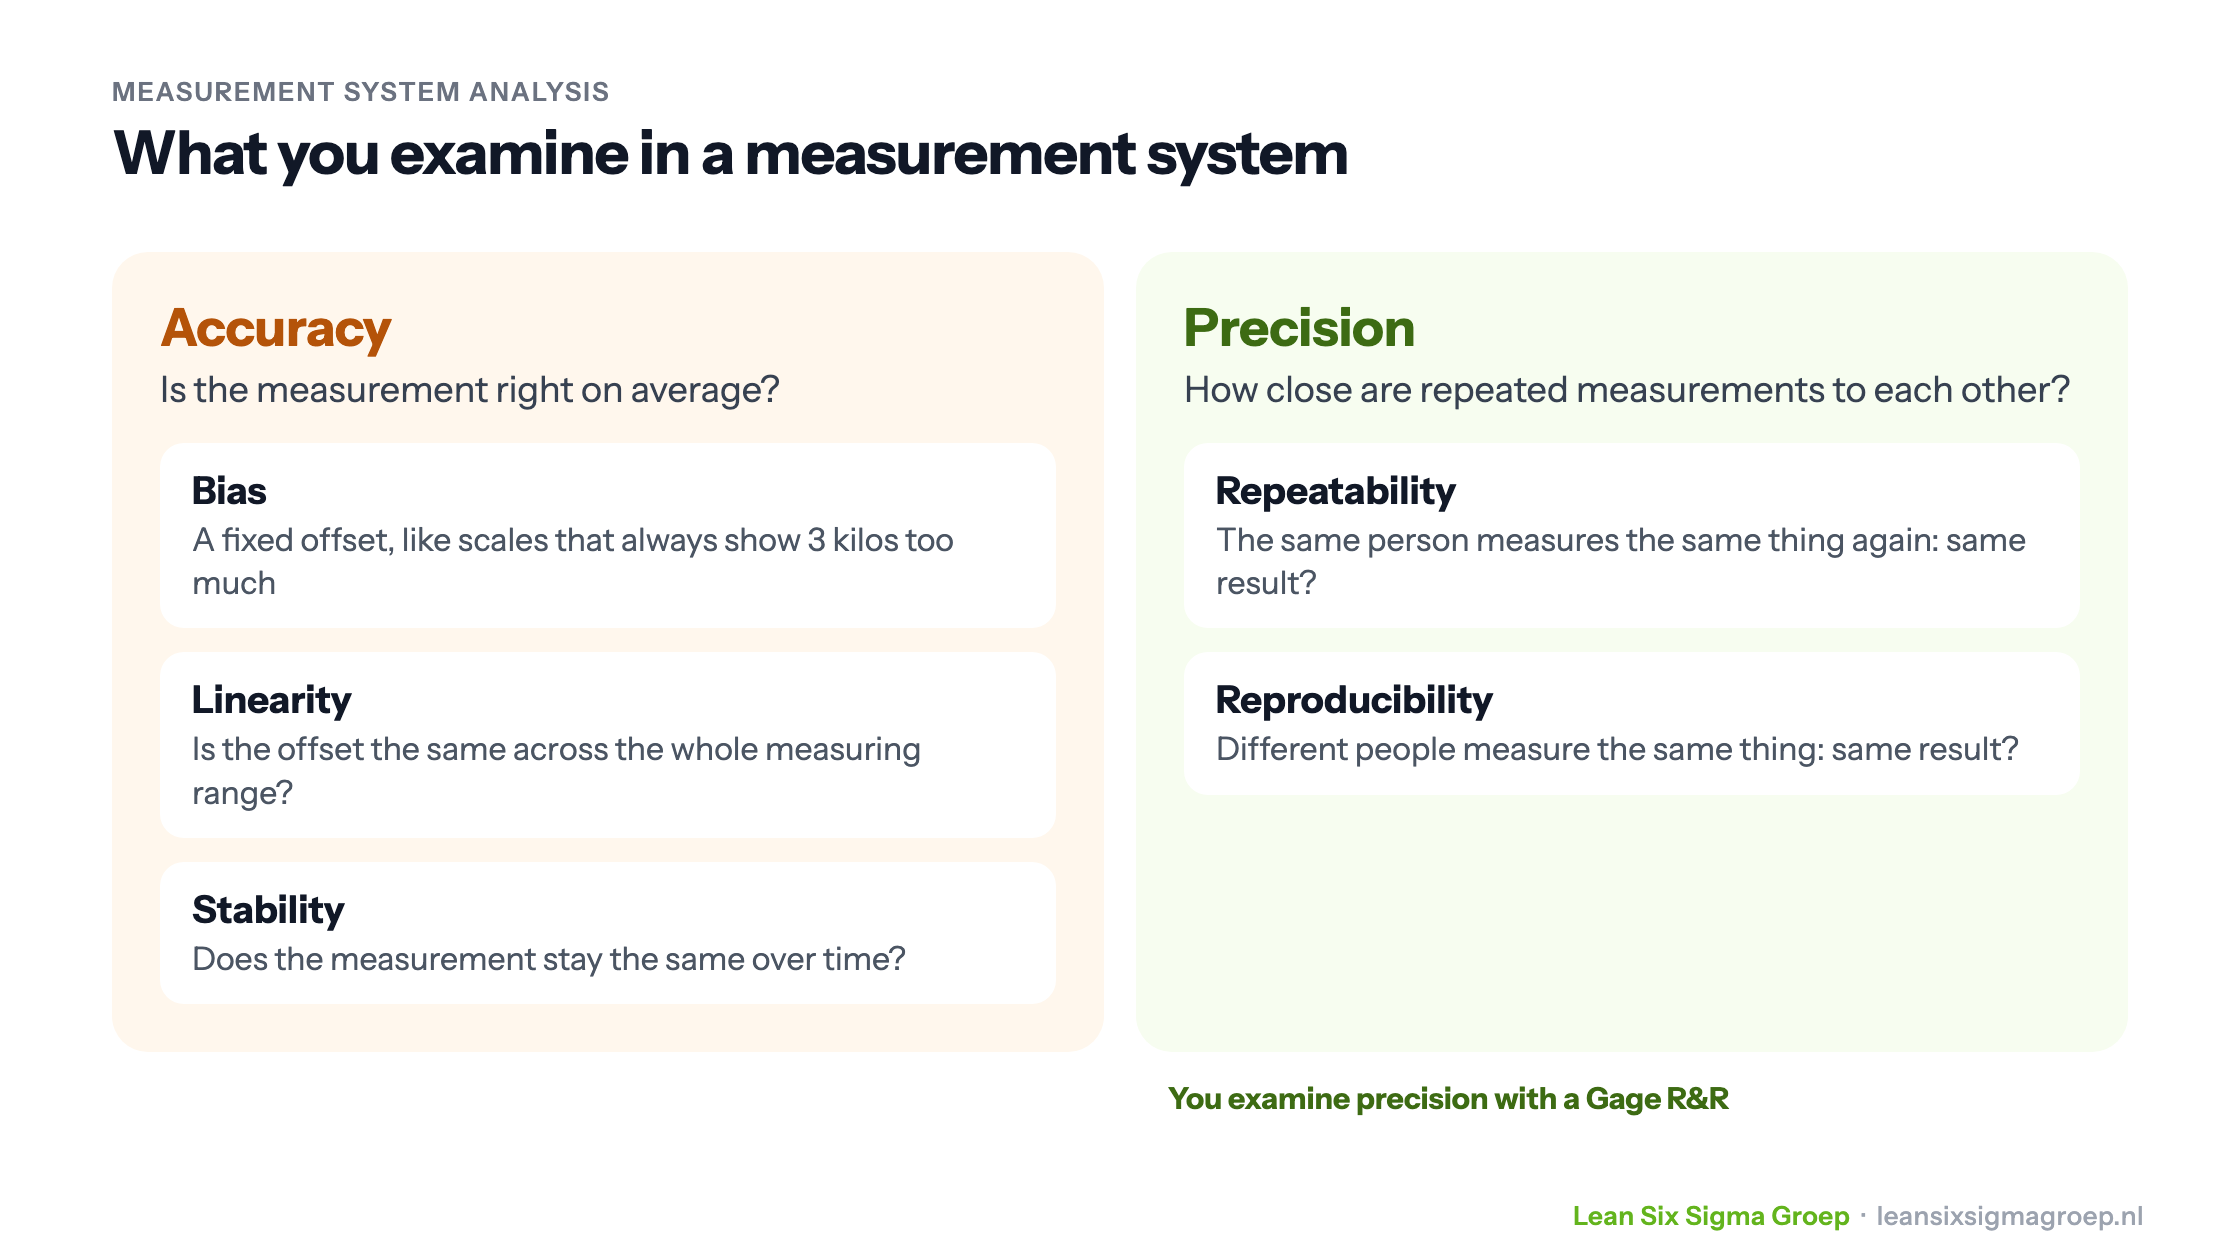
You examine precision with a Gage R&R: it measures how much spread there is in repeated measurements by the same person (repeatability) and between different people (reproducibility). You detect bias by measuring a reference whose true value you know, and determining the offset.
Bias in research and data collection
Bias can also arise in surveys, interviews and data collection. The best-known forms:
- Selection bias: the sample doesn’t properly represent the group you want to study. For example if you only survey customers of one branch.
- Non-response bias: the people who respond differ from those who don’t. In a customer satisfaction survey, for example, mainly dissatisfied customers respond, while satisfied customers are underrepresented.
- Social desirability: with personal questions, such as the number of drinks per week, people tend to give the answer they think is expected.
- Interviewer bias: the interviewer influences the answers, often unconsciously, through how questions are asked or how they respond.
- Confirmation bias: the researcher already has an expectation and mainly looks for data that confirms it.
- Interpretation bias: participants or researchers interpret a question or result differently than intended.
Note: outliers are not bias in themselves. A few extreme values may be chance, or may contain important information. Investigate them, but don’t simply throw them away.
How do you prevent bias?
- Check and calibrate measuring instruments, and carry out a measurement system analysis before you start measuring.
- Record a clear measurement instruction, so everyone measures the same way.
- Choose a sample that represents the whole group well, and keep track of who doesn’t respond.
- Ask neutral questions, and let the data speak before drawing conclusions.
Reliable measurement and preventing bias are covered in depth in the Green Belt training course.