Yield literally means output or return. In finance it is a return on investment, but in Lean Six Sigma it means something else: what share of what a process produces is good? There are three variants, and the difference between them shows how much work is hidden in rework. In addition, the Z-score tells you how predictably a process meets its requirements.
Yield
Ordinary yield, or final yield, is the share of products or services that are good at the end of the process: they meet what the customer wants. That customer can be an end user, but also a colleague further down the process.
Yield = number of good units / total number of units
A yield of 85% means that of the 100 products or services delivered, 85 were right. Yield and defect rate complement each other: together 100%.
First Time Yield
Final yield doesn’t tell you how a unit became good. Perhaps it was right first time, perhaps it was sent back three times. First Time Yield (FTY, also First Pass Yield) therefore looks, per process step, at the share that is right first time, without rework or repetition.
An example: of 100 requests, 90 are right first time, and 10 are sent back and corrected. In the end all 100 are right: a final yield of 100%. But the First Time Yield is 90%. The difference is the rework, which stays invisible in the final yield. Also read First Time Right.
Rolled Throughput Yield
If a process has several steps, you multiply the First Time Yields of all steps. That is the Rolled Throughput Yield (RTY): the chance that a unit passes through the whole process right first time.
Rolled Throughput Yield = FTY step 1 × FTY step 2 × FTY step 3 × …
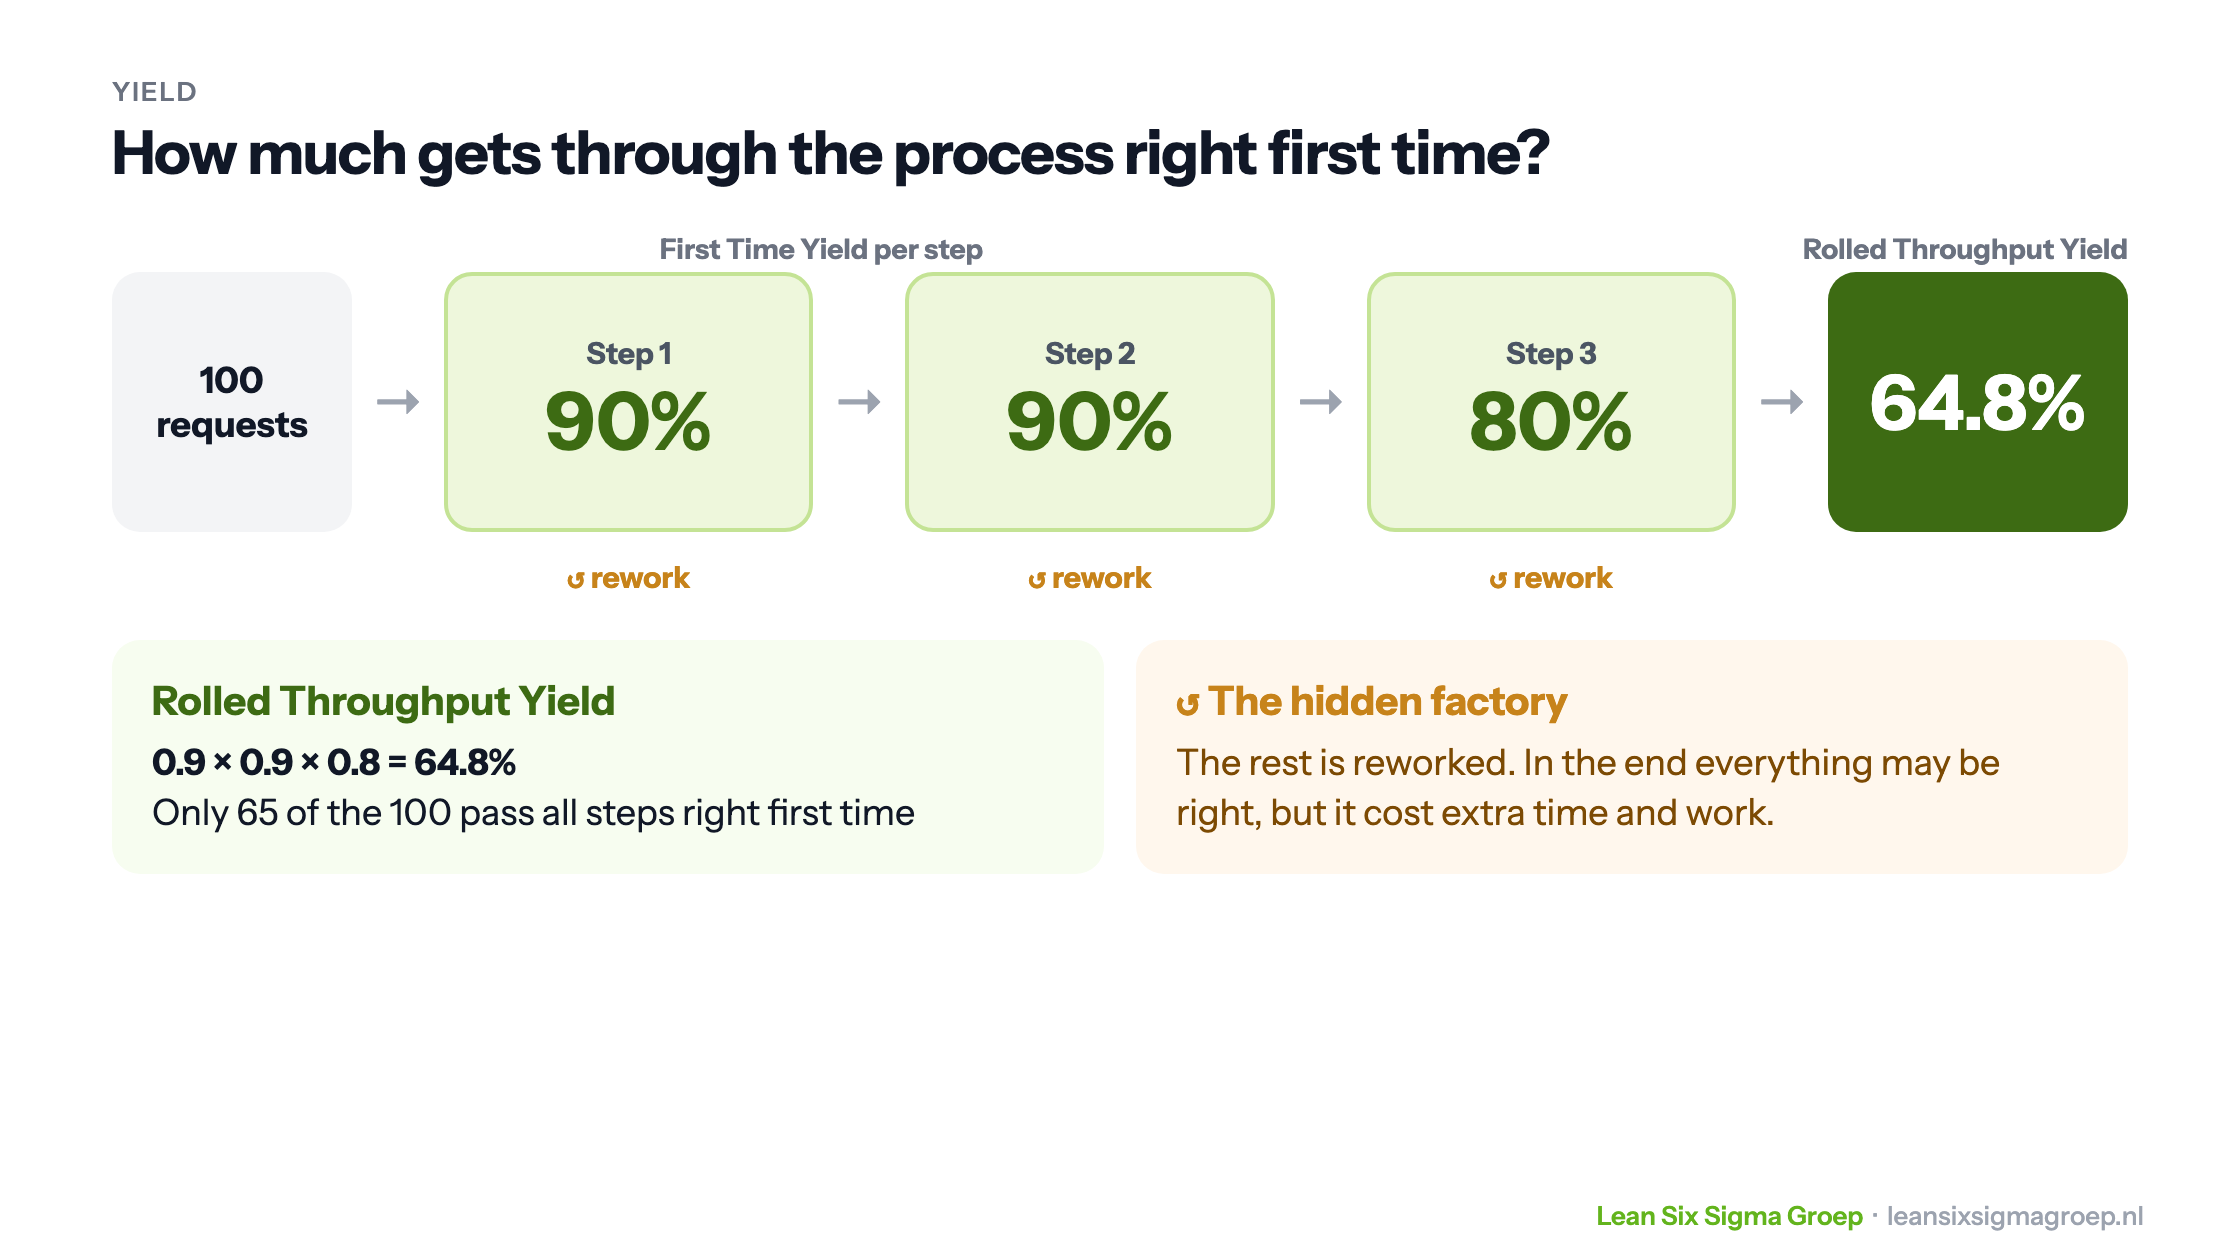
If a process has three steps with a First Time Yield of 90%, 90% and 80%, the RTY is 0.9 × 0.9 × 0.8 = 64.8%, as shown in the image at the top of this article. Each step on its own seems reasonable, but only 65 of the 100 units pass through the whole process right first time. The rest are corrected somewhere.
All that rework is called the hidden factory: a second organisation within the organisation, busy putting mistakes right. It costs time, money and capacity, and it lengthens the lead time. It also appears among the wastes of TIM WOODS, as the D of defects.
Where do you use it?
- Services: how many customer queries, applications or incidents are handled right first time, without calling back, adding information or reopening?
- Manufacturing: how many products pass every step of the line without rework? The step with the lowest FTY is often a good place to start improving.
- Suppliers: what share of what a supplier delivers is usable first time?
The Z-score
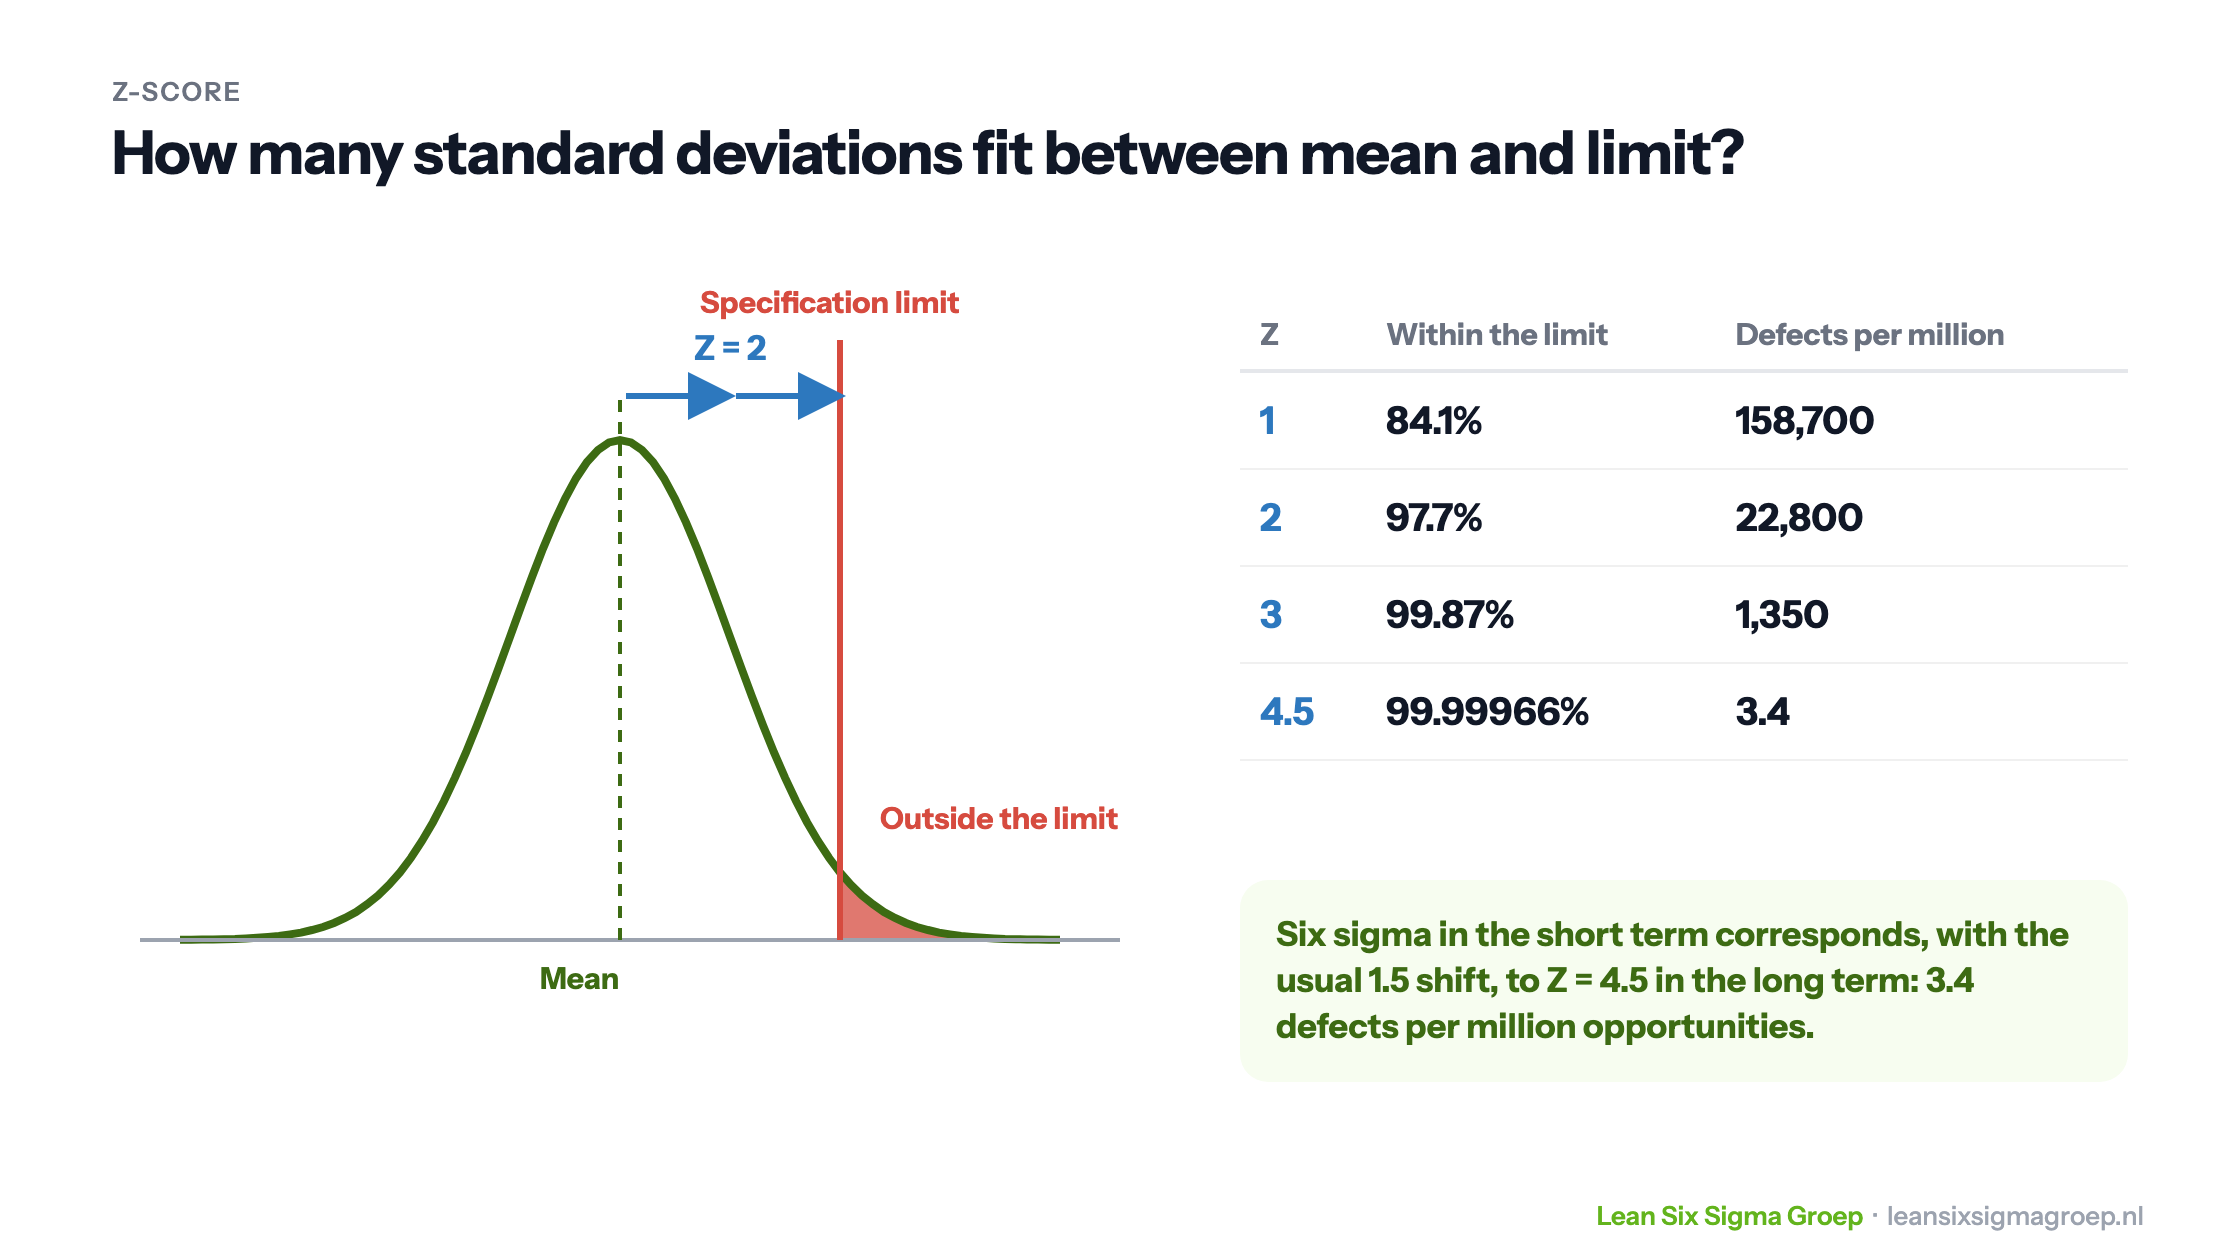
Yield counts what went wrong. The Z-score looks ahead: how likely is the process to meet the requirements? It says how many standard deviations fit between the process mean and the specification limit, the limit the customer sets.
Z = (specification limit – mean) / standard deviation
Suppose the customer wants their quote within 10 days, the mean is 6 days and the standard deviation 2 days. Then Z = (10 – 6) / 2 = 2. With a normal distribution you look up in a Z-table which share falls within that: 97.7%. About 2.3% of quotes are late.
The higher the Z-score, the smaller the tail beyond the limit, and the more predictably the process meets the requirements. There are two ways to get there: move the mean further from the limit, or reduce the spread. Six Sigma focuses mainly on the latter.
Z-score and sigma level
In Six Sigma the Z-score is often called the sigma level. One caveat applies. In the short term a process usually performs better than in the long term, because the mean shifts somewhat over time. Six Sigma therefore allows for a shift of 1.5. A “six sigma” process in the short term has a Z of 4.5 in the long term, which comes down to 3.4 defects per million opportunities.
Related to the Z-score is Cpk, which expresses the same in a different unit: Cpk is the smallest Z, divided by 3.
Why does this matter?
- The hidden factory becomes visible. A high final yield can hide a lot of rework; RTY shows how much.
- You know where to start. The step with the lowest First Time Yield drags the whole process down most.
- You can predict. With the Z-score you know not only how it went, but how it will go.
- Defects cost money. A higher yield means less rework, shorter lead times and more satisfied customers.
In the Green Belt course you learn to calculate yield and the Z-score, chart them, and use them to convince others that a process needs to improve.