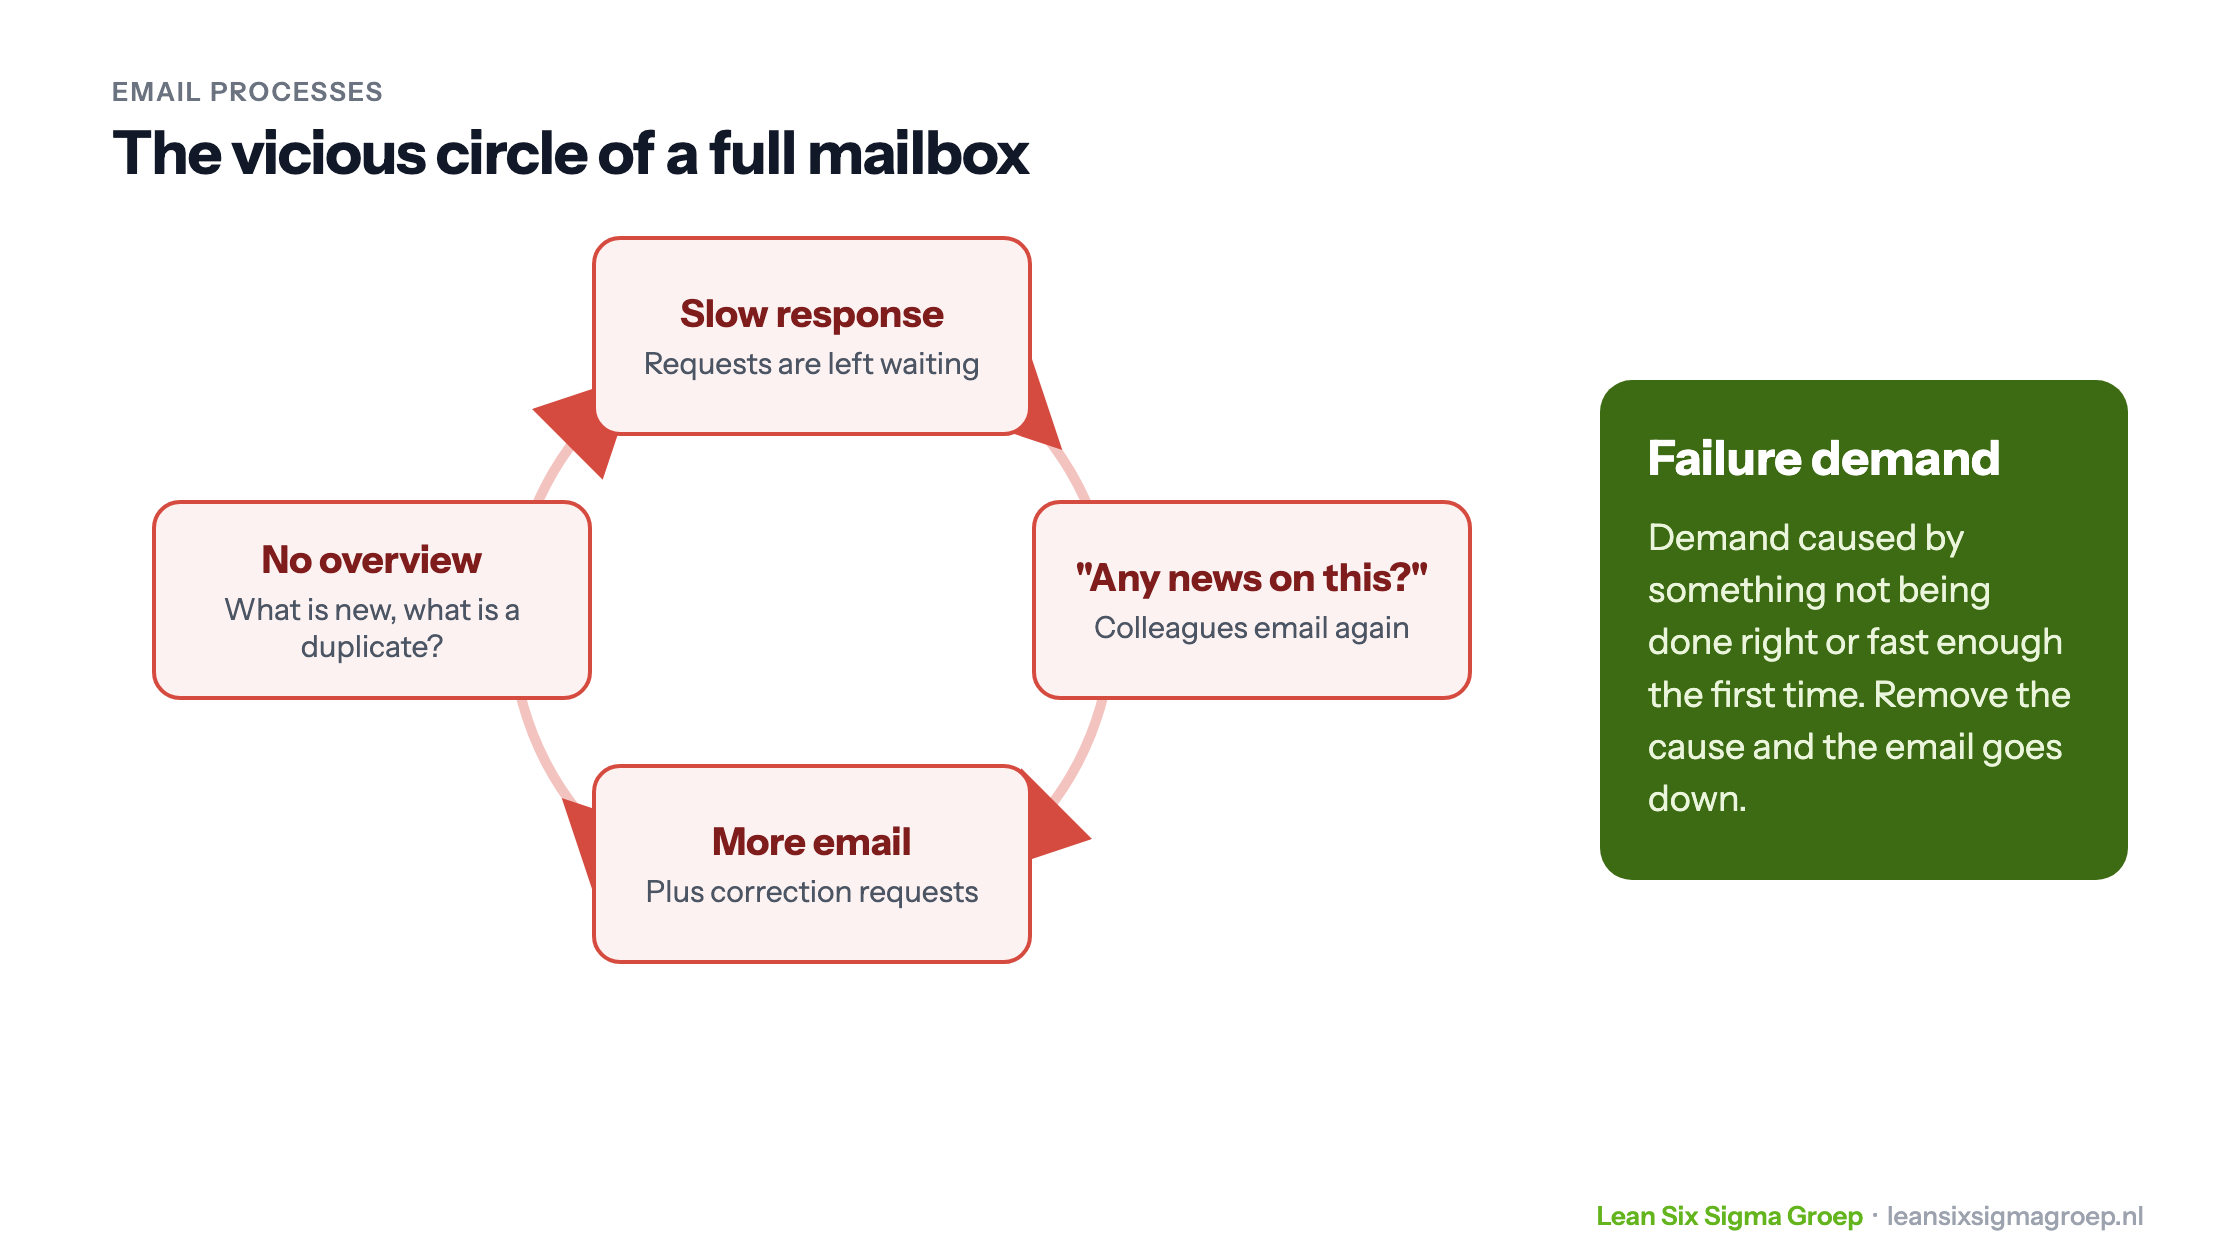
Picture it: a facilities department receives hundreds of emails from colleagues every day. Replace a light, order office supplies, refurbish an entire room. Staff do their very best, but they can’t respond quickly and correctly to everything. So colleagues email again: any news, or is this right? The mailbox fills up further, overview disappears, and everyone gets frustrated.
The vicious circle
What happens here is shown in the image at the top of this article. A slow response leads to status queries. Those lead to more email, more email to less overview, and so to an even slower response. Working harder doesn’t break that circle; the process has to change.
John Seddon calls such emails failure demand: demand that only arises because something wasn’t done right or fast enough the first time. “What is the status of my request?” and “What you sent isn’t right” are failure demand. In many service processes a large share of all contact is failure demand. The good news: removing the cause brings not only faster handling but also less email.
Six Sigma and DMAIC
Six Sigma is a data-driven approach to reducing errors and variation in a process. The steps of DMAIC work just as well for email processes as for a factory:
- Define: what is the problem? For example a lead time that is too long or too variable, many errors or too many repeat queries.
- Measure: measure the process. How many requests come in per day, of which type, how long does handling take, and how many emails are failure demand?
- Analyse: find the causes of the long lead time and the variation.
- Improve: improve the process, for example with a fixed distribution of work, a web form instead of free-form email, or automatic confirmations.
- Control: sustain the improvement with agreements, training and continued measurement.
The example: the facilities department
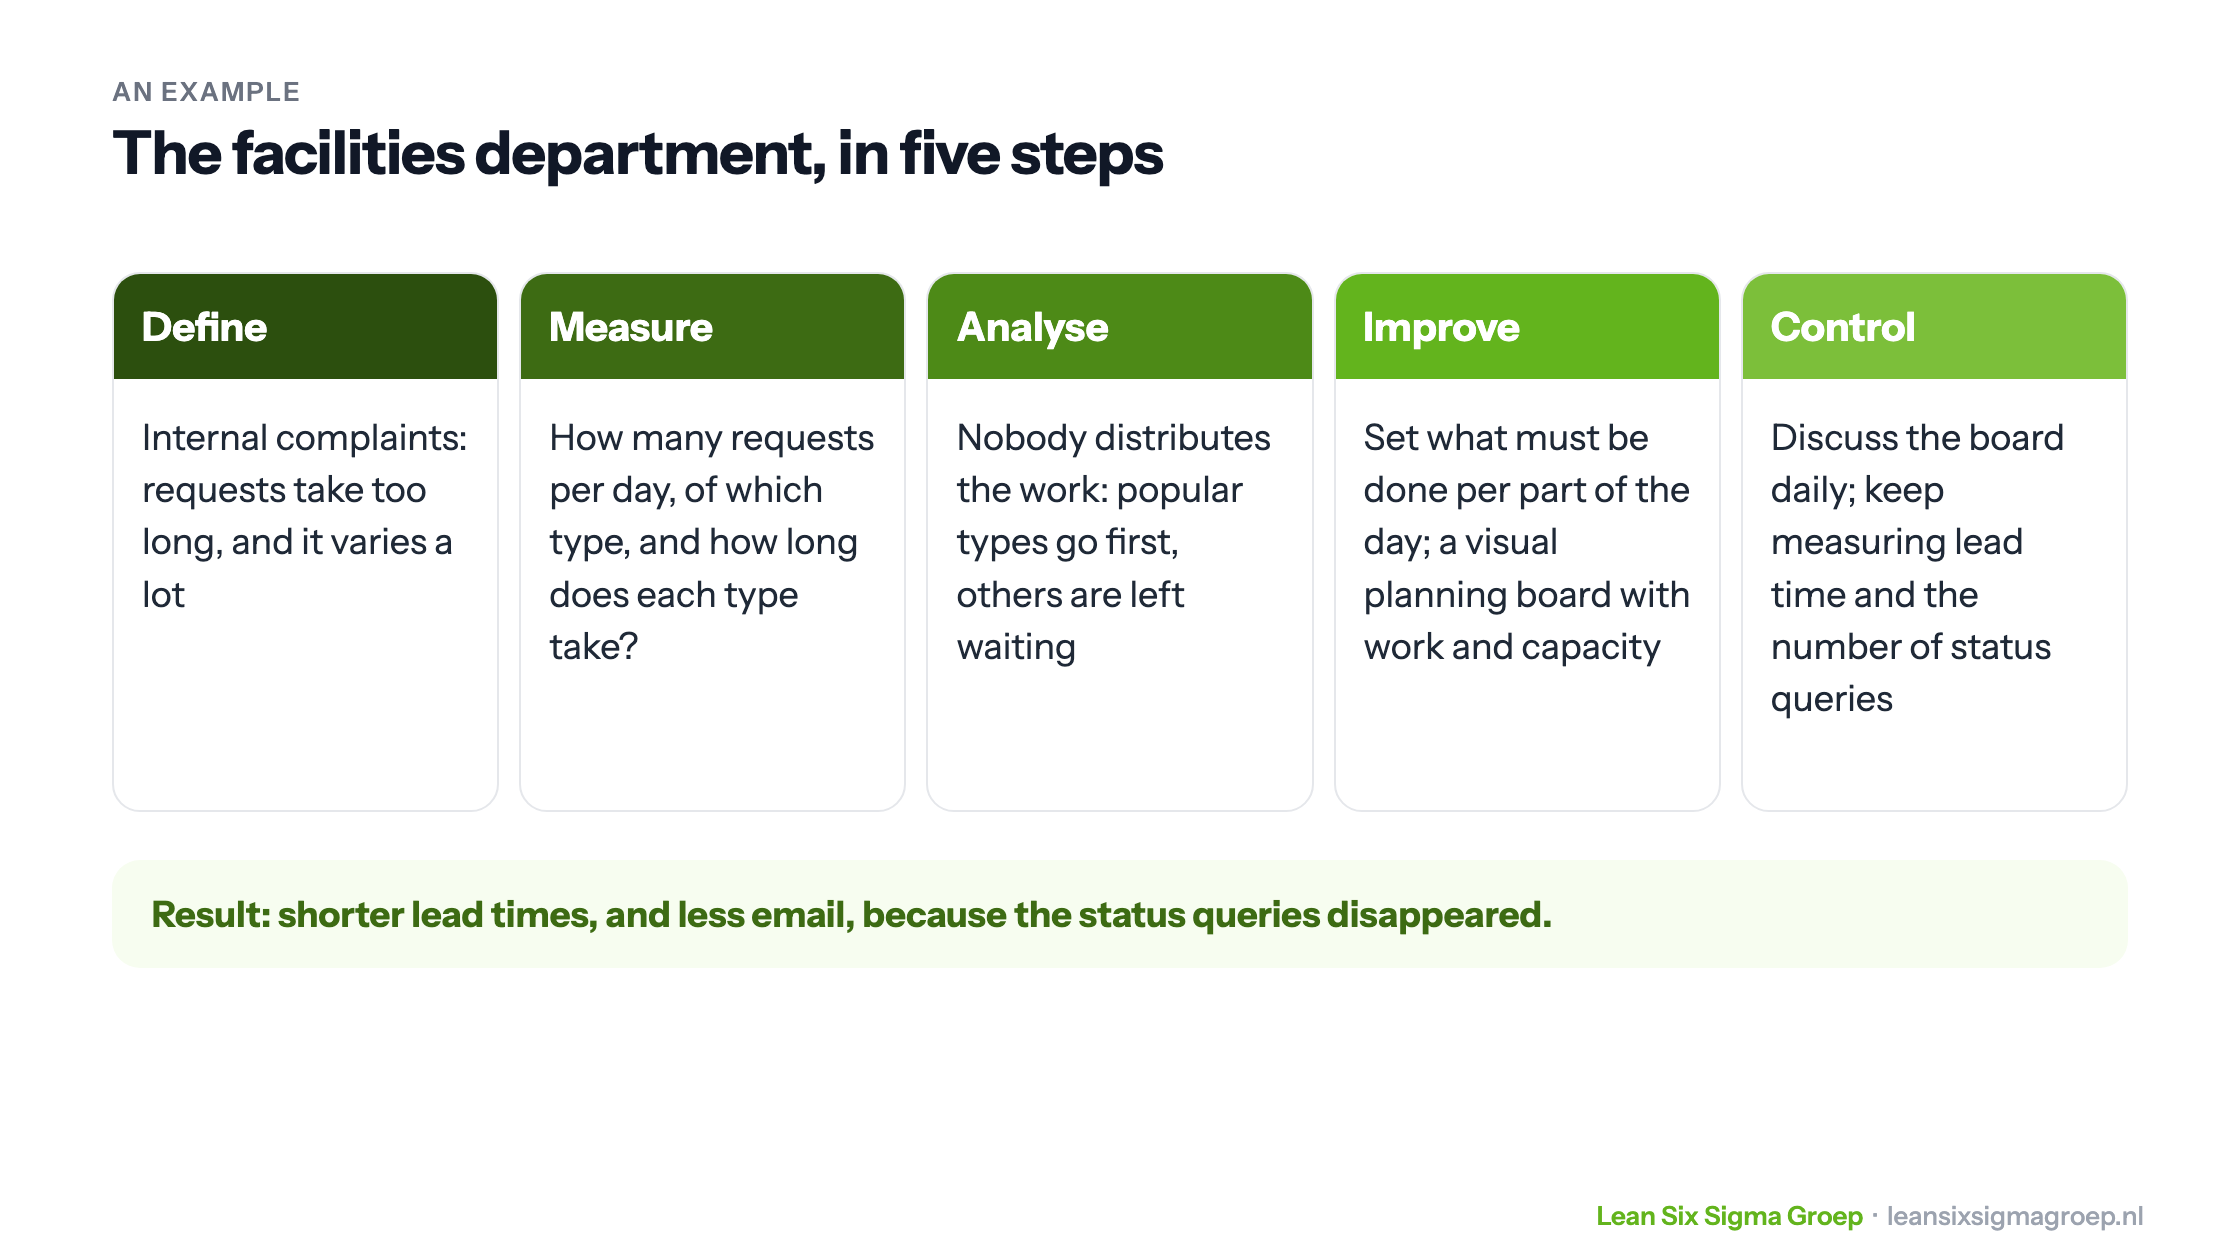
The facilities department from the start of this article received many internal complaints. Requests took too long, and the lead time varied a lot. The overview above summarises what they did.
When they looked at the process, it turned out nobody distributed the work systematically. Colleagues often picked up the same type of request, so other types were left waiting. By measuring for a while how many requests of each type came in per day, the department knew what had to be done per part of the day so requesters didn’t wait too long. Lean calls this the rhythm of customer demand, or takt time.
With that they built a visual planning board, showing per hour how much work there was and how much capacity it needed. The team discussed the board every day. Lead times went down, colleagues were helped sooner, and the number of emails fell: hardly anyone asked any more whether their request was being handled.
Tips for your own mailbox
- Count the failure demand. For a week, tally which emails are new questions and which concern an earlier one. That number makes the problem visible.
- Make the work visible. A shared mailbox hides how much work is waiting. A board, digital or physical, shows what comes in, what is in progress and what is done.
- Standardise the request. A form with the right fields prevents emails back and forth about missing information.
- Say where it stands. An automatic confirmation with an expected completion date saves many status queries.
Also read process optimisation, or learn to lead such an improvement project yourself in the Green Belt course.