ANOVA stands for analysis of variance. It is a hypothesis test that checks whether the means of three or more groups really differ, or whether the differences could also be down to chance. For example: does the average lead time differ between three teams, or is the difference too small to say anything about?
How does ANOVA work?
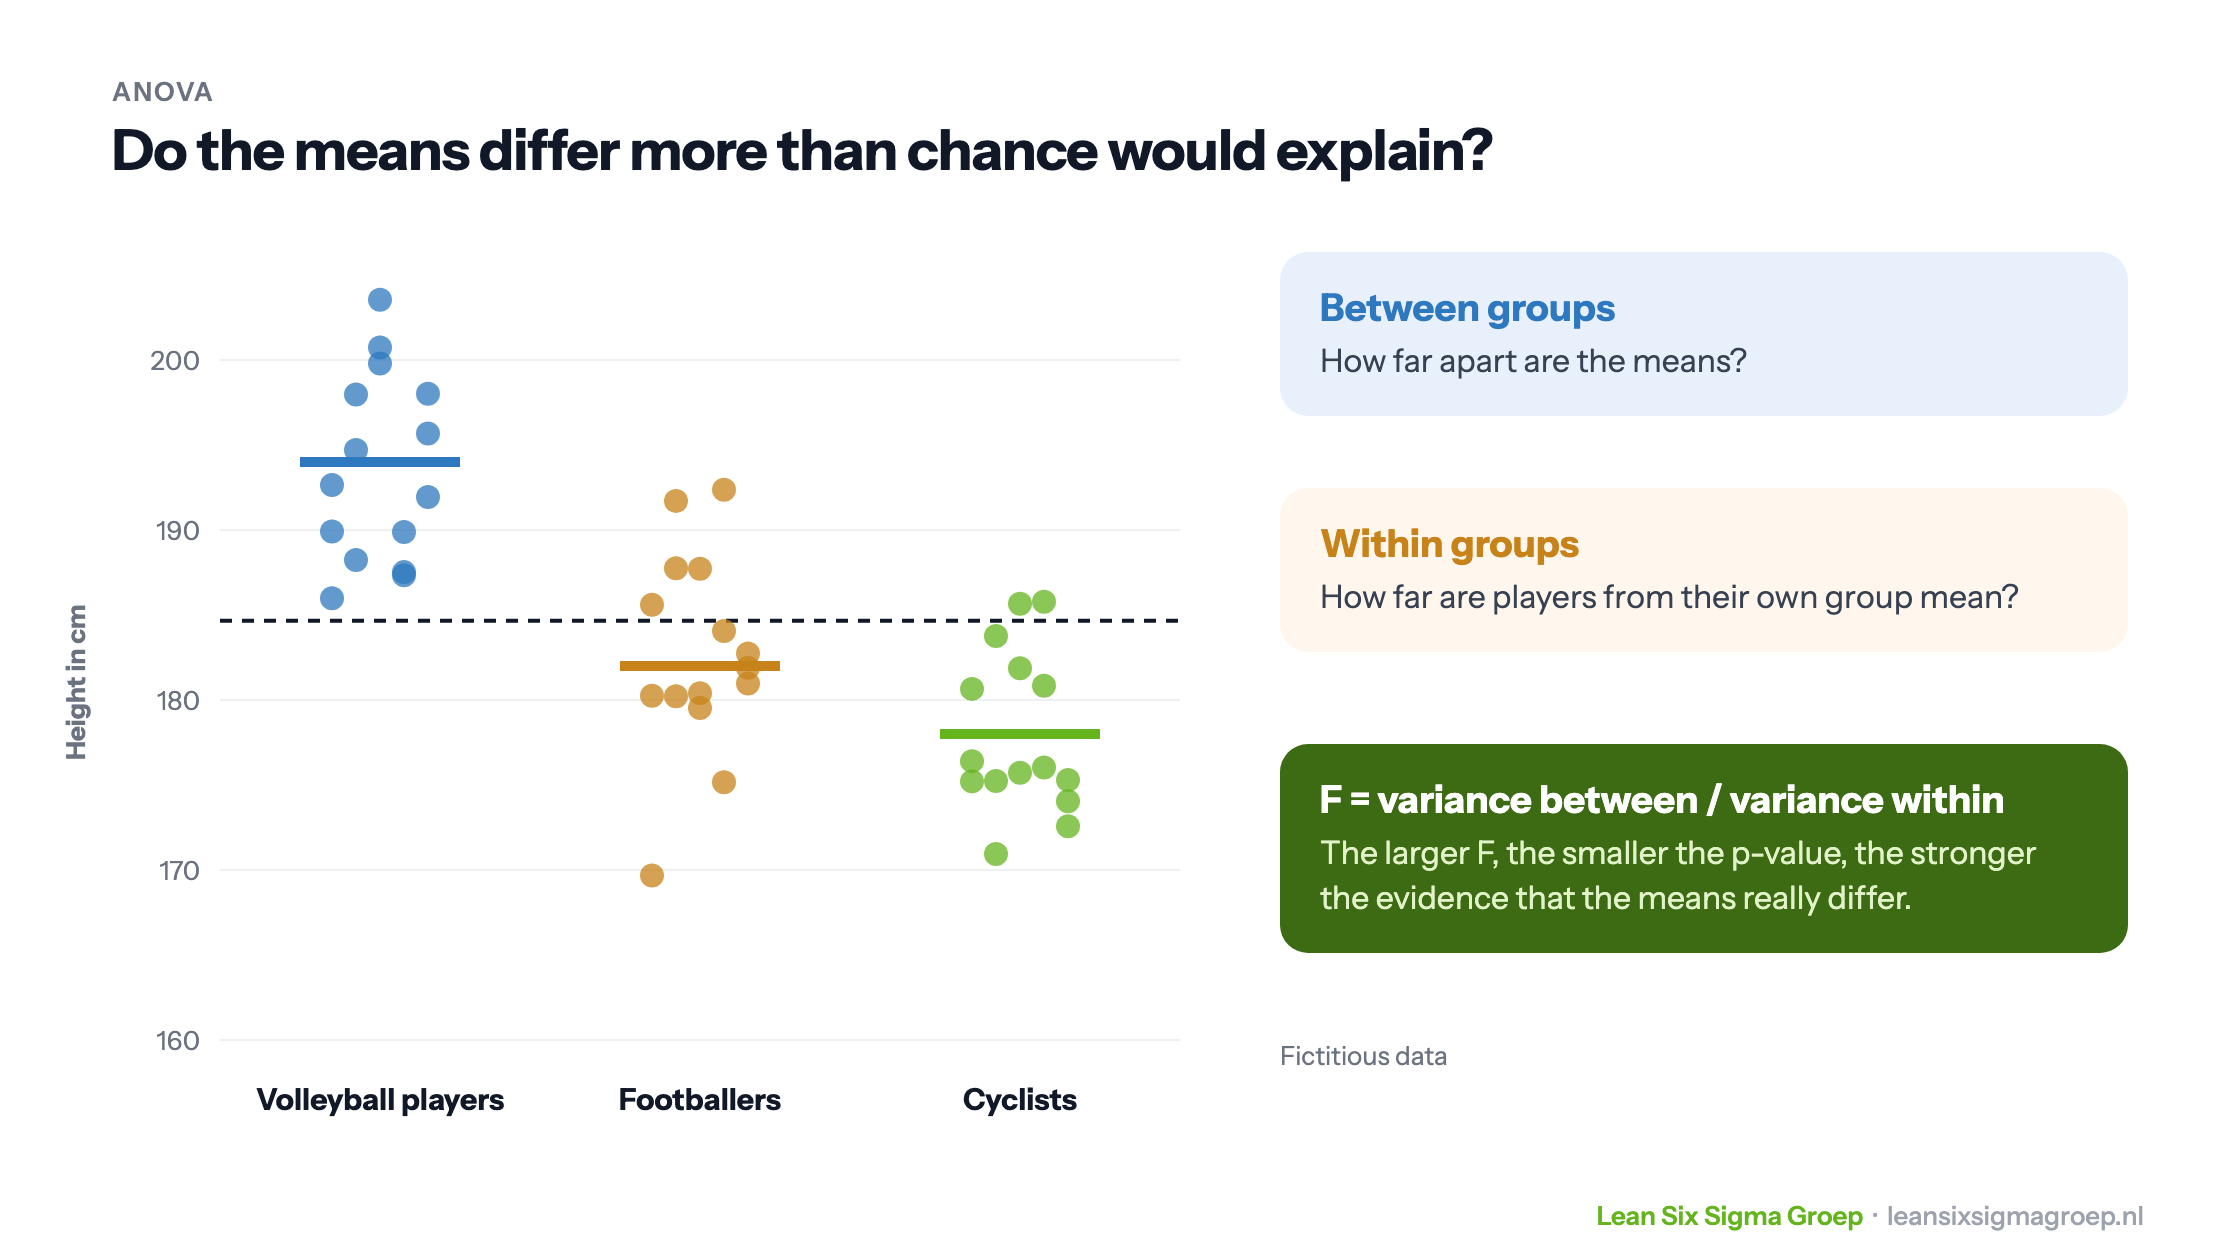
The name is misleading: ANOVA compares means, but does so through the spread. The test splits the total variation in the data into two parts, as shown in the image at the top of this article:
- Variation between groups: how far apart are the group means?
- Variation within groups: how far are the observations from their own group mean?
The ratio between the two is called F. If the variation between groups is much larger than the variation within groups, F is large, and it is unlikely that the differences are due to chance. The test expresses this as a p-value.
Reading the p-value
- p below 0.05: at least one group has a different mean. The difference is statistically significant.
- p above 0.05: no difference has been shown. That is not the same as proving there is no difference: the difference may be small, or the sample too small to detect it.
Note: ANOVA only says there is a difference somewhere, not between which groups. For that, after a significant outcome, you run a follow-up test, such as Tukey’s, which compares the groups pairwise.
An example
We compare the height of volleyball players, footballers and cyclists. Within each group there are differences: not all cyclists are equally tall. The question is whether there are also differences between the groups that are larger than that spread would lead you to expect.
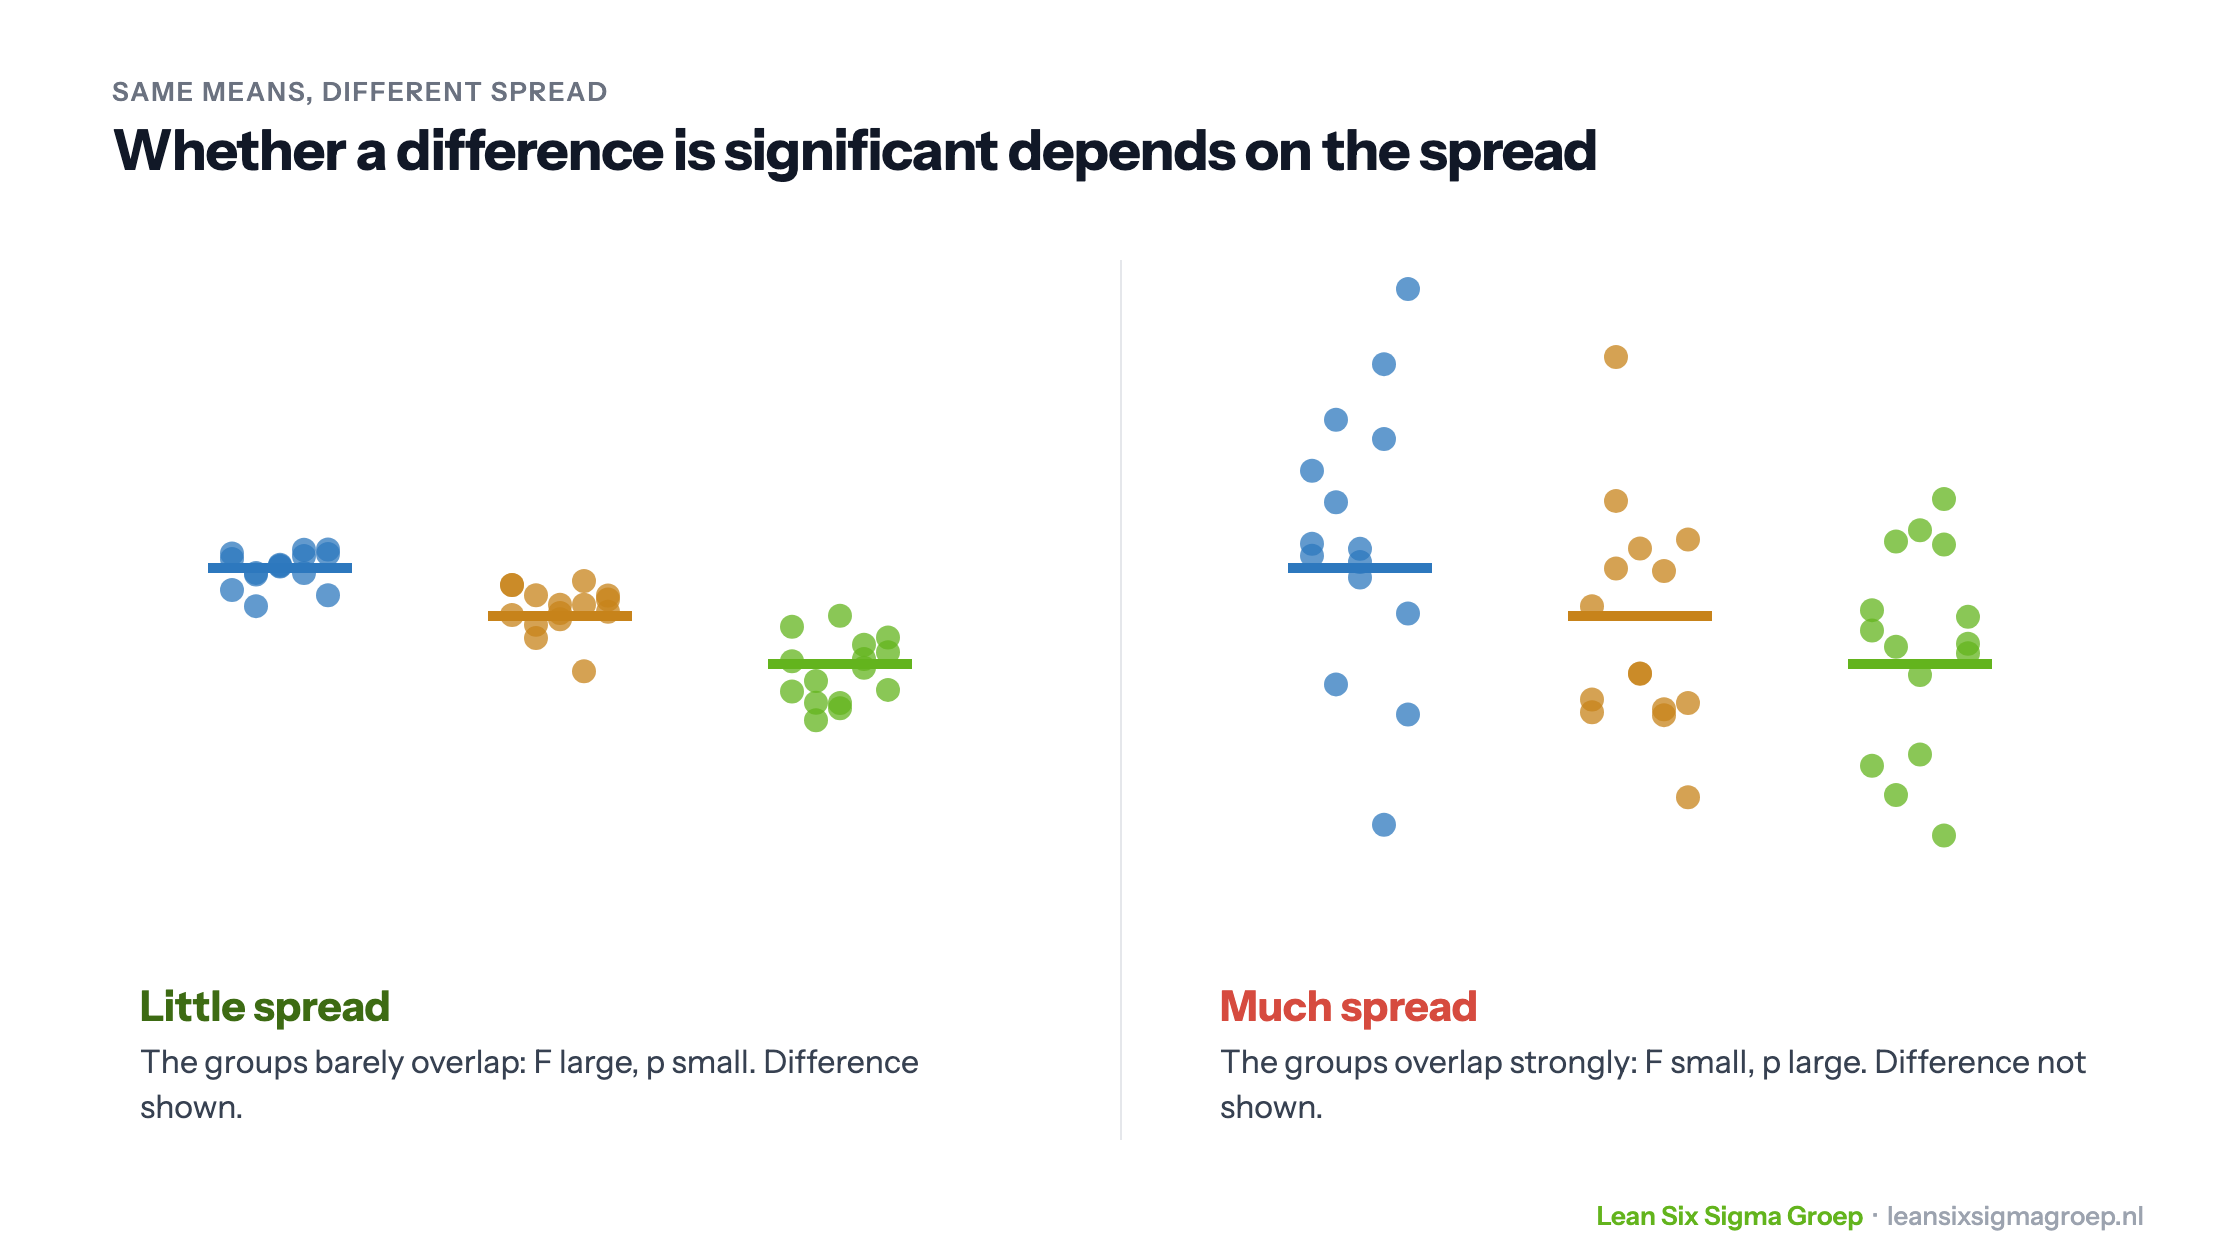
So whether a difference is significant depends not only on how far apart the means are, but also on the spread. Below are two situations with the same means. On the left the spread is small and the difference is shown, on the right the spread is large and it isn’t.
One-way and two-way
In the example there is one factor: the sport, with three levels (volleyball, football, cycling). Height is the outcome, the Y. That is called a one-way ANOVA. If you also look at a second factor, for example sex, it is a two-way ANOVA. That also shows whether the two factors influence each other, the so-called interaction. It is also the basis of a Design of Experiments.
Assumptions
ANOVA relies on a few assumptions:
- The observations are independent of each other.
- The data in each group is roughly normally distributed. With larger groups this matters less.
- The spread is about the same in all groups. If not, there are variants of the test, such as Welch’s ANOVA.
So always start with a graph, such as a box plot per group. It shows the means, the spread and outliers at a glance.
ANOVA and Six Sigma
Six Sigma is about reducing variation. In the Analyse phase of a project you want to know which factors really influence the outcome. Does lead time differ by team, by day or by type of request? ANOVA tests that, instead of concluding on gut feeling. It is one of the hypothesis tests used in a Lean Six Sigma project.
Who invented it?
The British statistician and geneticist Ronald Fisher developed the analysis of variance in the 1920s, for agricultural experiments. The F in the test is named after him.
Tools
By hand, an ANOVA takes a lot of calculation. Statistics programs such as Minitab and SPSS give the result in seconds, and Excel can also run a simple ANOVA. In the Black Belt course you learn how to choose the test, run it and explain the outcome.