Flowchart
The many advantages of a flowchartA flowchart is a schematic representation of a process. Applications like Visio, Lucidchart and Blue Dolphin are used to draw how a customer’s question is converted into an answer. Visualizing the process provides insight. And that is a starting point for change.
Preparatory work flowchart
Creating a flowchart goes beyond simply using an application; that’s the least of your worries. To chart a process effectively, you require the involvement of the individuals who are directly engaged in that process. Their hands-on experience and insights into how things genuinely function are invaluable. They can pinpoint where real-world practices deviate from the theoretical guidelines established in work instructions and can guide you through the maze of exceptions. A useful tool is 5x why; in other words: ask open, judgment-free questions, and don’t stop after the first answer.
If we call a flowchart a “drawing”, we may safely call the outcome of the preparatory work, described above, a “sketch”. This sketch is frequently created on brown paper, employing post-it notes (I recall days at a prior employer when, in my role as a Black Belt, I was humorously questioned about why I wasn’t strolling through the hallways armed with a substantial roll of ‘brown paper‘ and an assortment of colorful post-it notes).
Generating this sketch often requires more than one session. Additionally, the validation of the sketch by involving several employees who are intimately familiar with the process adds substantial value. Following this, the construction of the flowchart commences.
Building the flowchart
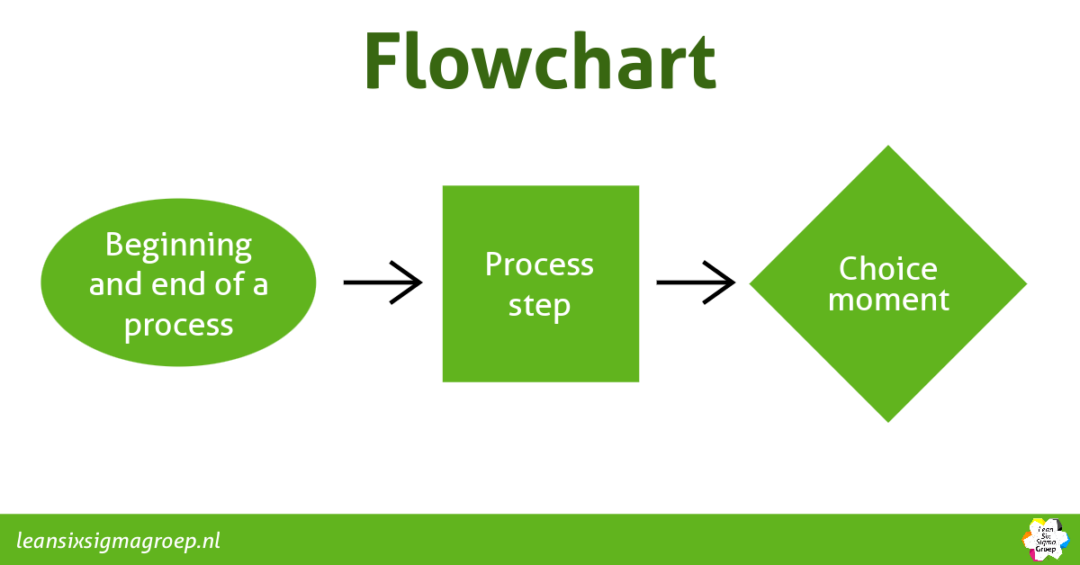
To create a flowchart, we use symbols and arrows. The three most commonly used symbols are:
1. Oval
An oval represents the beginning and end of a process.
2. Square
The square represents an activity, a process step. Examples: registering mail, file review, milling panels.
3. Diamond or ‘Wybert’ (like the diamond-shaped licorice)
The diamond represents a choice moment in the process. This is often a check. For example: has the file been properly assessed? Or: does the request meet our criteria? The outcome is then yes or no, so the process branches out in two (or more) continuations.
The arrows connect the symbols and show the direction of the process.

Flowchart as a starting point for improvement
As I previously mentioned, a flowchart offers valuable insights and can serve as a foundation for improvement. In processes laden with numerous controls, it’s beneficial to inquire about the rationale behind these controls and their actual contributions. Similarly, when confronted with an abundance of detours or expansions within a process, it warrants a thorough examination. And as is often the case, the questions of “5-times-why” remains a highly effective means of exploration.
Finally, a flow chart is also a valuable tool for training employees. By linking work- and system-instructions to the process steps in the flowchart, the employee can be taken through the work step by step.
All in all, a flowchart is much more than just a drawing: it provides insight, can be a starting point for improvement and helps training employees.
Example of a Flowchart
The video below explains how flowcharts work. Visualizing process steps, decisions and actions helps readers to follow the flow of a process and to understand connections between the different parts.