
A flowchart is a schematic representation of a process. Step by step, you draw how, for example, a customer’s question is turned into an answer. Making the process visible creates insight, and that is the starting point for improvement.
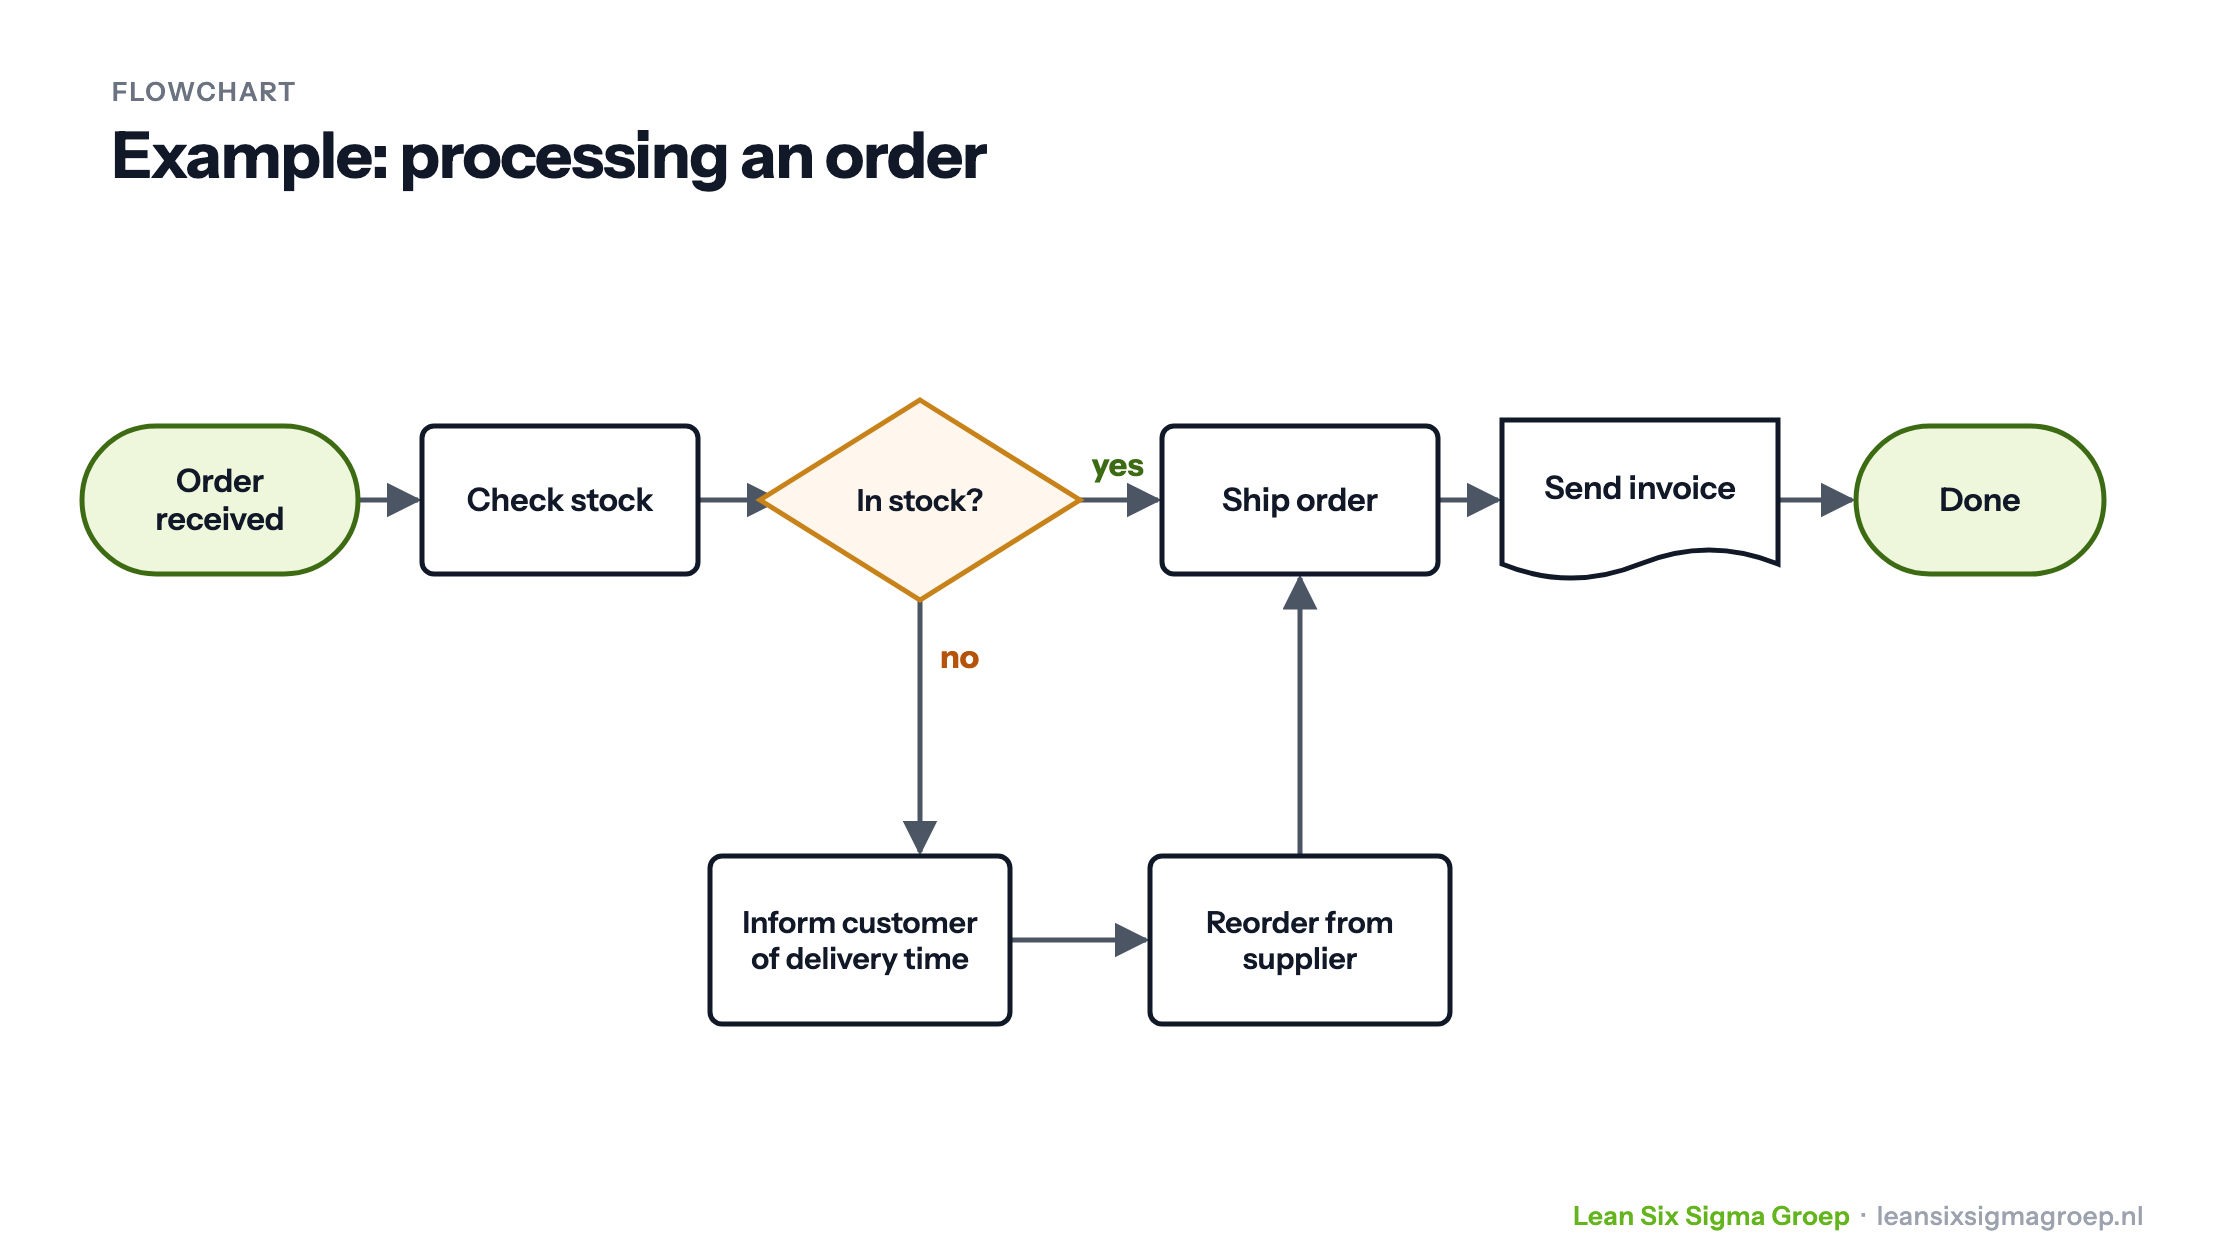
The image at the top of this article shows an example: processing an order, with a decision point (is the product in stock?) and the two routes that follow from it.
Preparation: talk first, then draw
You can make a flowchart with programs such as Visio, Lucidchart or BlueDolphin, but the program is the least of your worries. To map a process, above all you need the people who work in it.
Their knowledge of how things really work is essential. They know where practice differs from what the work instructions say, and they help you through the swamp of exceptions. At the same time, people often fall back on jargon, and it takes skill to find out what exactly happens. So keep asking, with open questions and without judgement.
What comes out of this is first a sketch, often on a roll of brown paper with sticky notes in all kinds of colours. One session is usually not enough, and it helps to have the sketch checked by several people from the process. Only then do you draw the flowchart.
Flowchart symbols
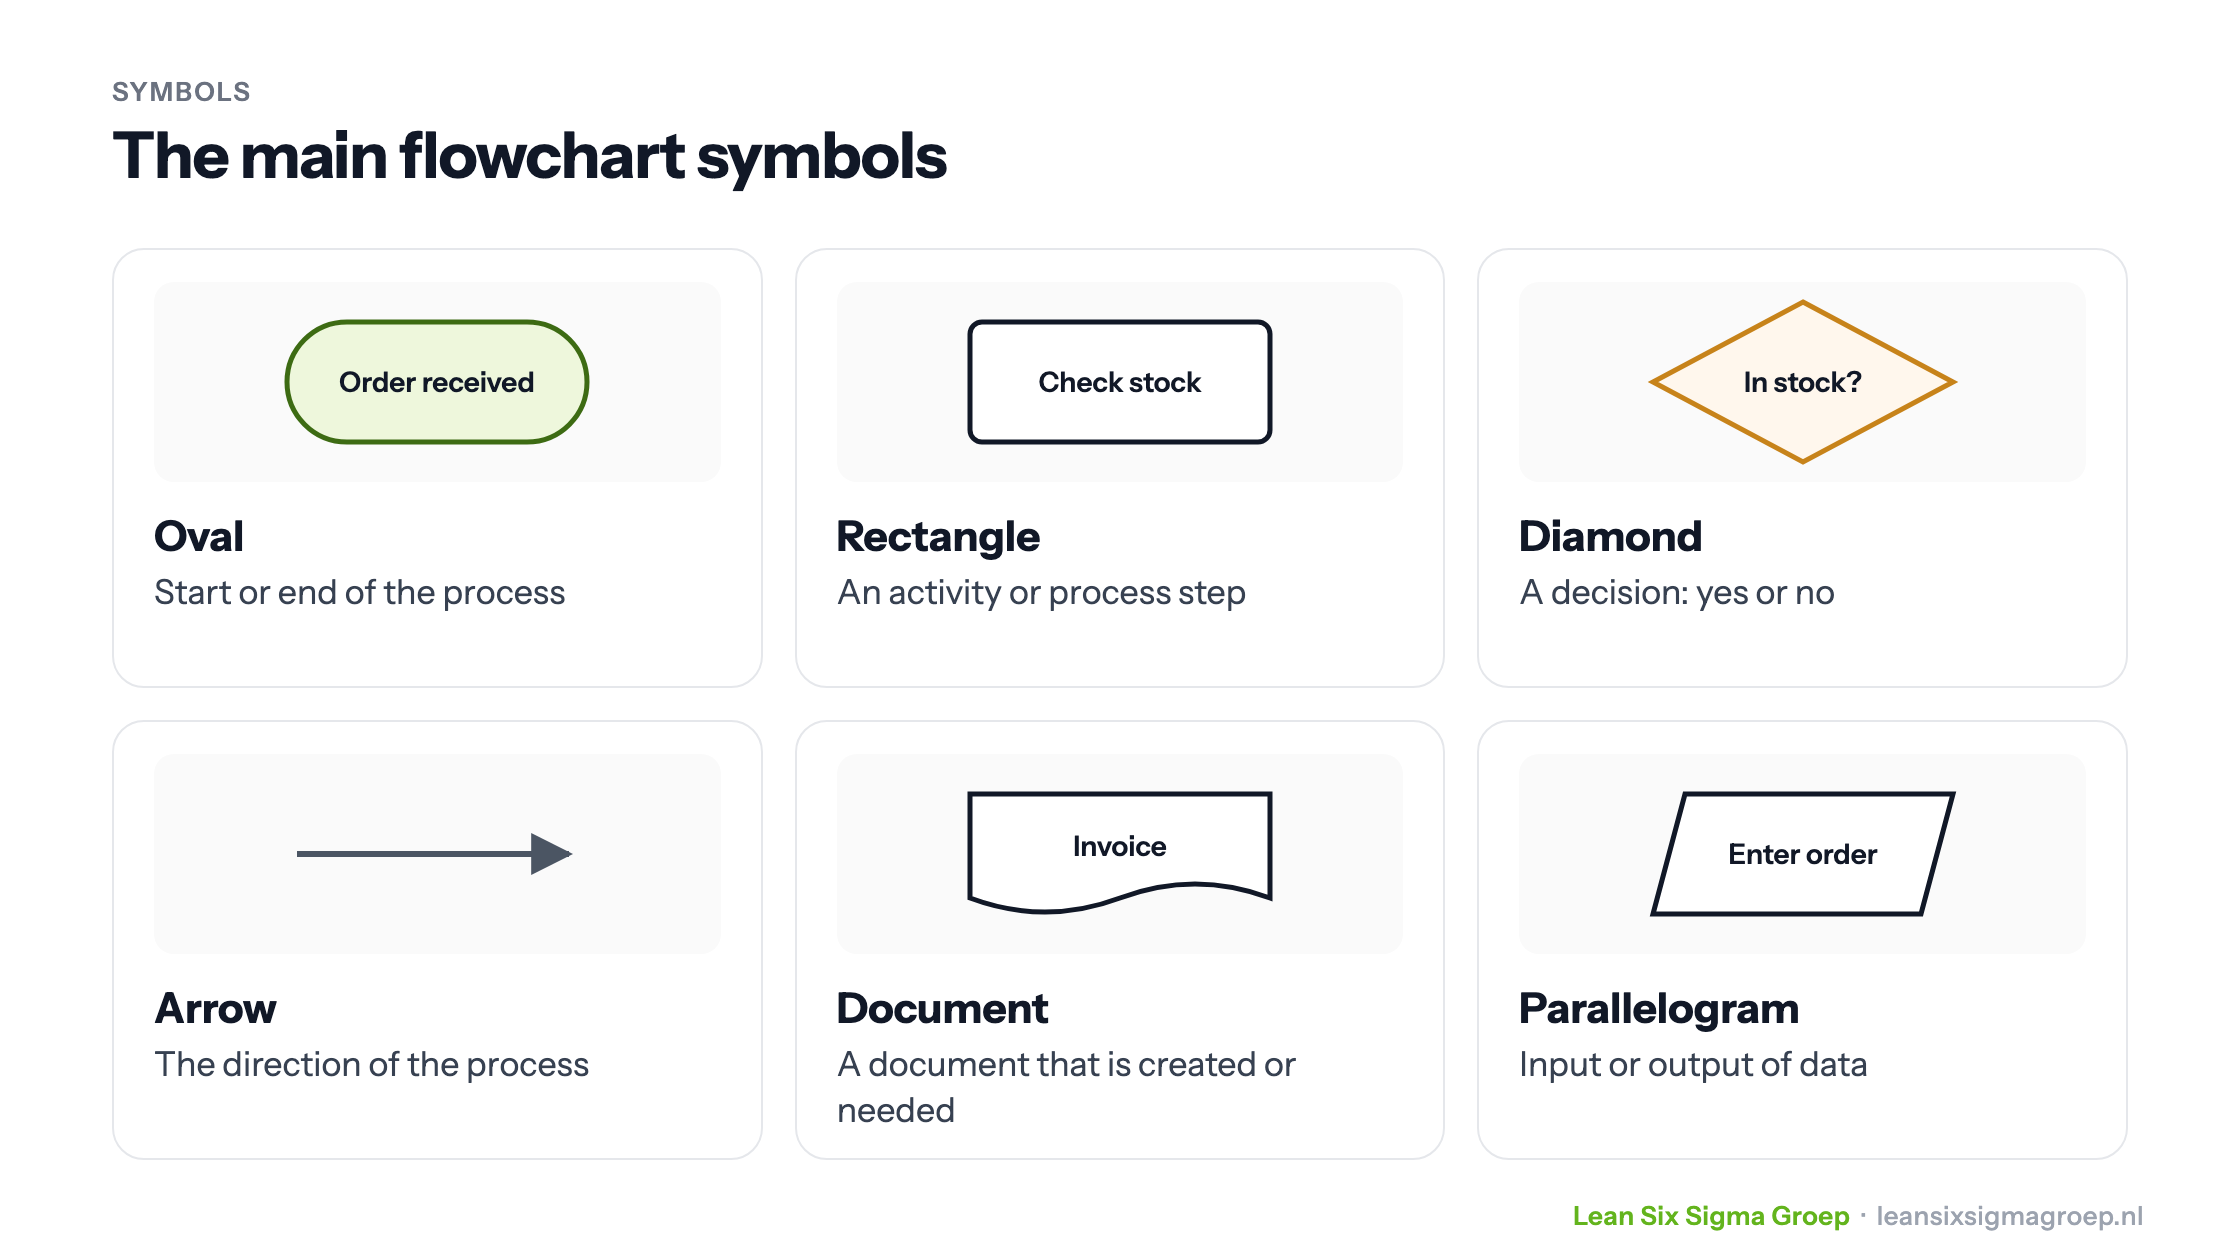
A flowchart consists of symbols connected by arrows. The three most important are the oval, the rectangle and the diamond:
- Oval: the start and end of the process.
- Rectangle: an activity or process step. For example: register mail, review a file, mill panels.
- Diamond: a decision point, often a check. For example: has the file been reviewed correctly? Does the request meet our criteria? If yes, the process goes one way; if no, the other.
- Arrow: connects the symbols and shows the direction of the process.
The document (something that is created or needed, such as an invoice) and the parallelogram (input or output of data) are also often used.
Keep a flowchart simple: one entry, one exit, and no more detail than you need to understand the process. If you also want to show which department or role carries out each step, make a swimlane diagram. If you need a fixed notation, for example to automate processes, use BPMN.
The flowchart as a starting point for improvement
A flowchart provides insight, which makes it a good starting point for improvement. Look out for:
- Many checks: ask yourself why you do them and what they deliver.
- Many branches and loops back: every loop back is often rework, and that is waste.
- Handovers and waiting points: that is where most lead time is lost. To make that time visible, use a value stream map.
As always, asking why is a good question here.
Useful for onboarding too
A flowchart is also a good tool for training employees. If you link work and system instructions to the steps in the flowchart, you can take a new employee through the work step by step.
All in all, a flowchart is much more than a drawing: it provides insight, is a starting point for improvement and helps with onboarding.
Want to learn how to tackle process improvement in your organisation? Read more about the Green Belt or Black Belt training course.
The video with this article explains how flowcharts work.
From theory to practice
Learn to apply this in practice
Topics like Flowchart are applied directly to an improvement project from your own organisation in the Green Belt training.
Next start dates
Lean Six Sigma Green Belt training →Not ready for a training yet?