
Where does Pareto analysis come from?
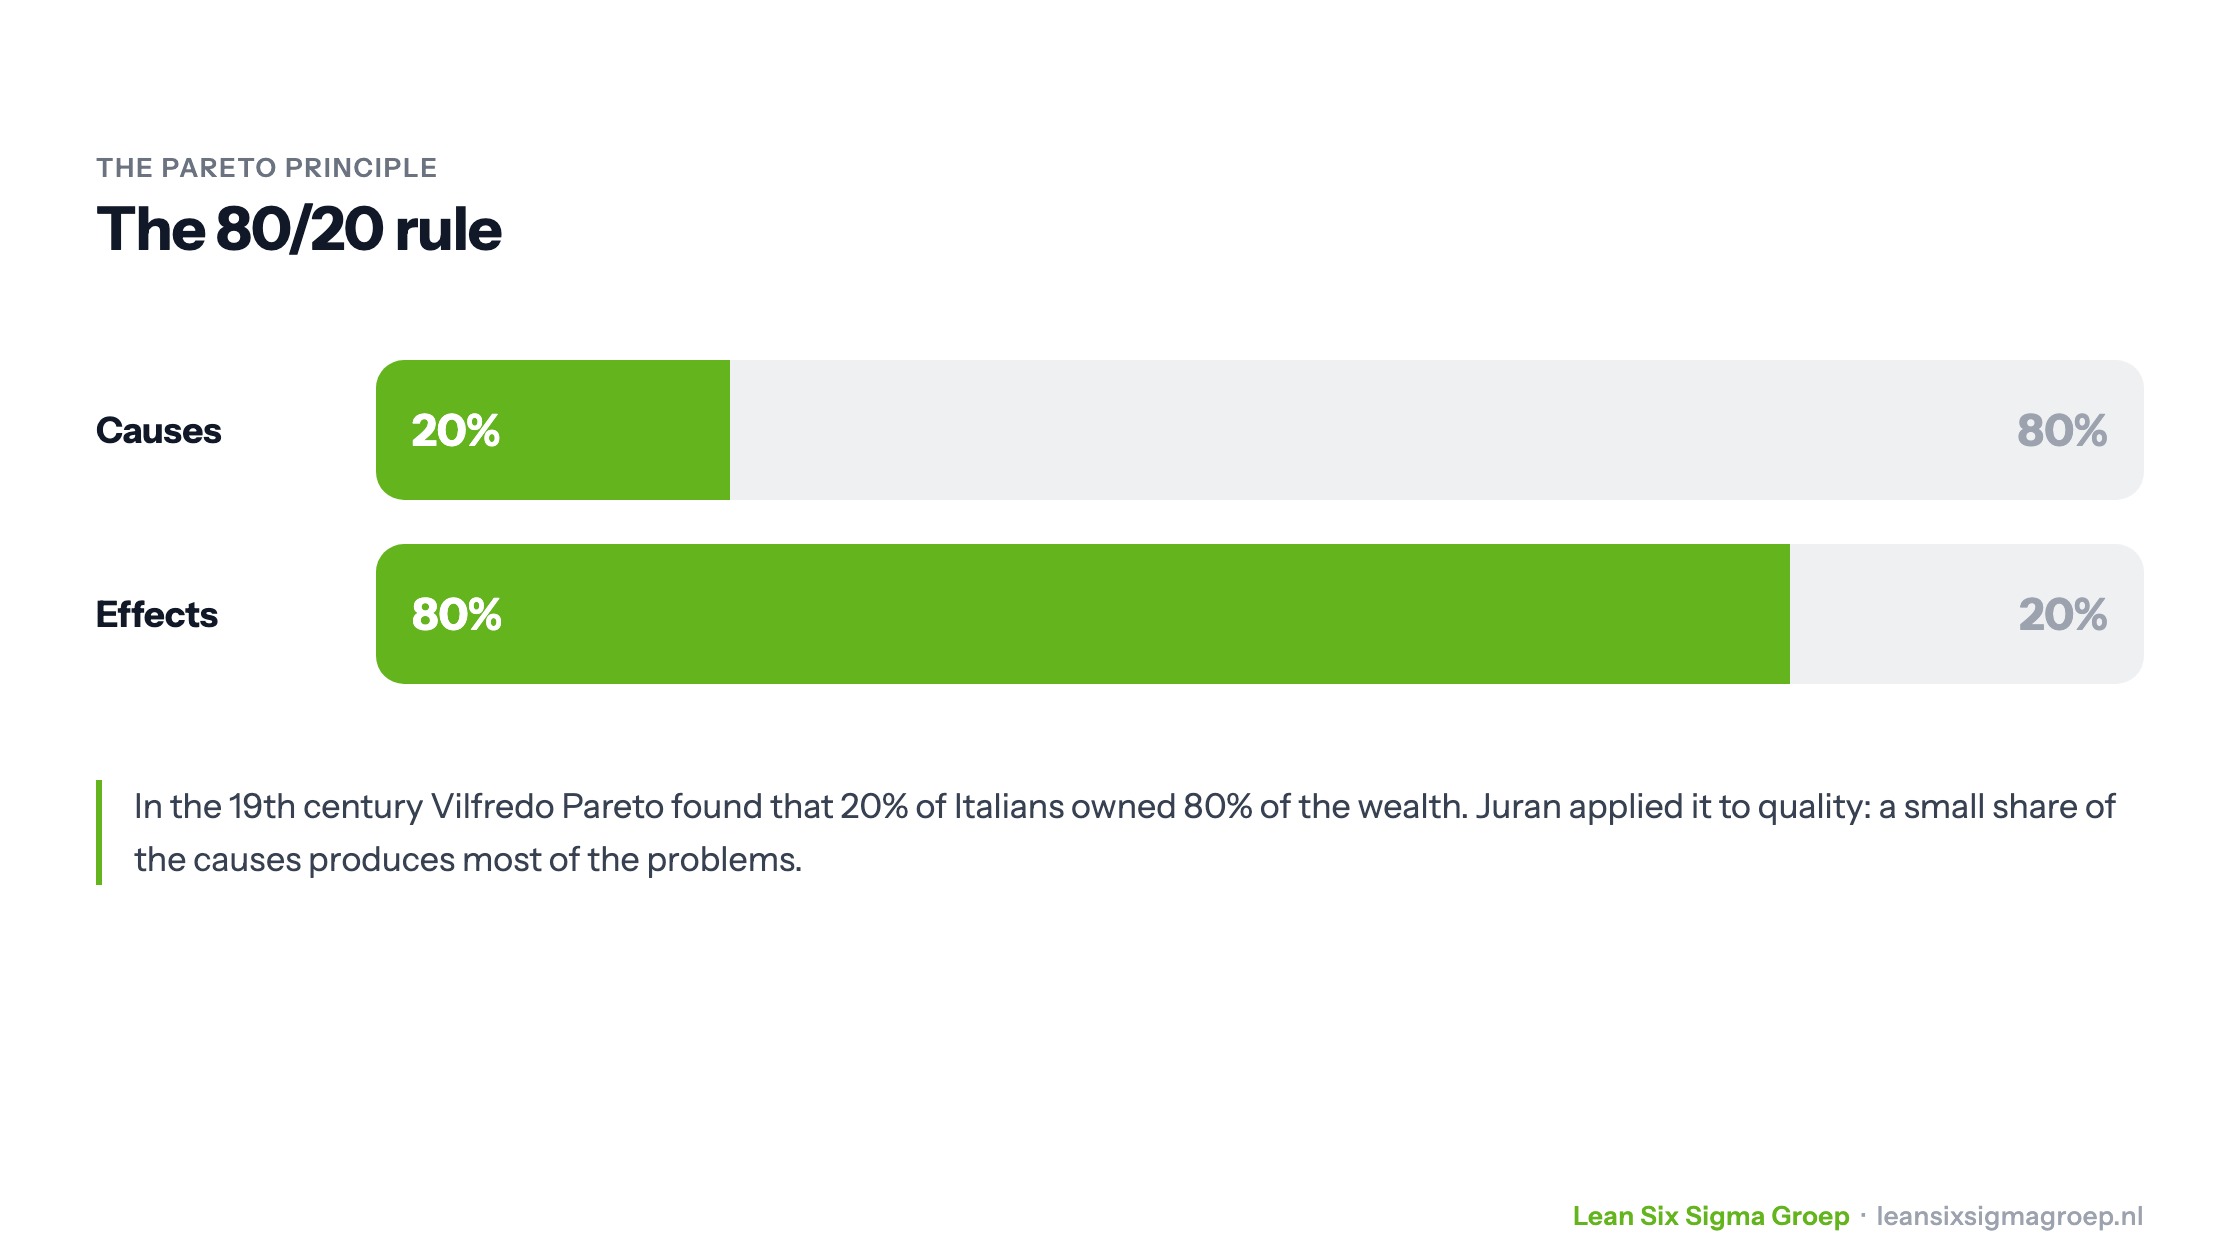
Joseph Juran introduced the analysis in the 20th century. He based it on a principle that the Italian economist Vilfredo Pareto had already observed in the 19th century: 80% of the wealth in Italy was owned by just 20% of Italian citizens.
We call this the Pareto principle, or the 80/20 rule. The principle has since been applied in many fields and is based on the Zipf distribution.
What is a Pareto analysis?
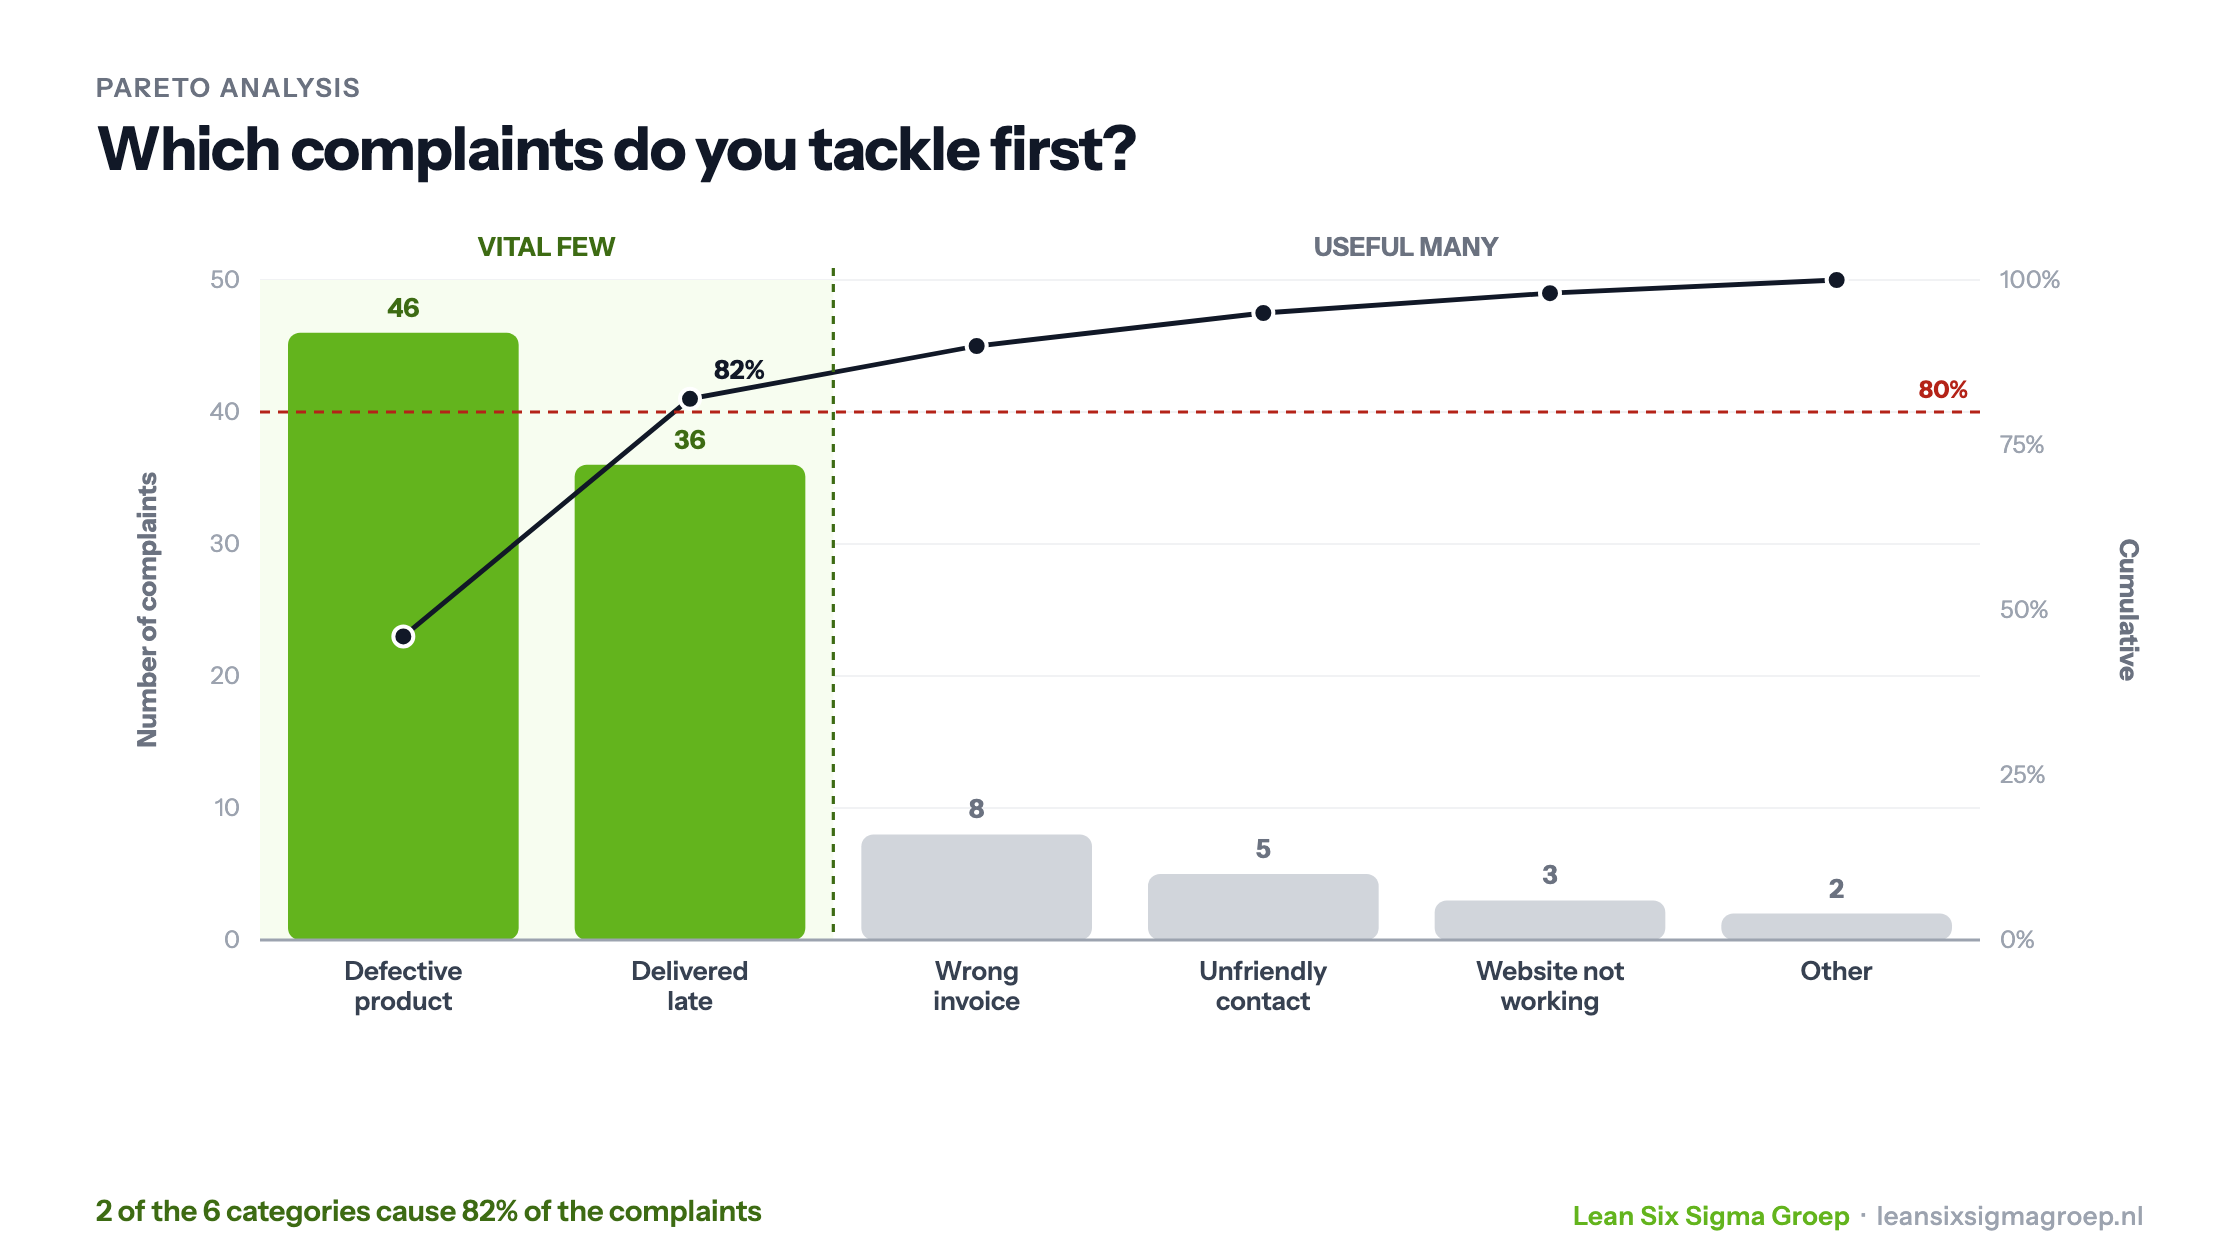
A Pareto analysis is a statistical technique you use when the metric you want to measure and improve is discrete. A typical example is the number of complaints an organisation receives in a given period.
Those complaints fall into several categories, such as “defects in the product or service delivered”, “the delivery was too late (or too early)”, and so on.
The Pareto principle predicts that 20% of the complaint categories account for 80% of all complaints in the measurement period.
Dedicated statistical software such as Minitab can generate a Pareto chart quickly and easily. Excel can do it too, but it takes some manual work. Ready-made Pareto templates for Excel are easy to find through Google.
This is one of the tools you learn to apply in the Green Belt training.
A Pareto chart has two parts: a bar chart with the bars sorted by height, and a curved line showing the cumulative total. Applying the 80/20 rule, the example chart shows that the first two categories (so 2 of the 6) together make up more than 80% of the total.
How do we use a Pareto analysis in a Lean Six Sigma DMAIC project?
Pareto can be used in several phases of a Lean Six Sigma DMAIC project. In the Define phase it can help you find the Y (the CTQ), for example by looking at the count of the different complaint categories over a given period.
In the Measure phase, a Pareto analysis shows how the process is performing when the Y is measured as discrete data.
In the Analyze and Improve phases we use a Failure Mode and Effects Analysis (FMEA). That is really a kind of Pareto too, because we only take forward the risks that reach a certain minimum RPN score.
The ‘useful many’
Juran introduced the Pareto principle into quality management in the middle of the 20th century, and it became one of the five guiding principles in his model. He is often misquoted.
When applying Pareto, people focus on the ‘vital few’ (the 20%) but forget that the remaining 80%, the ‘useful many’, can sometimes also reveal important root causes that help improve processes even further.
So in the first instance we can focus on the “vital few”, but sometimes it pays to take a look at the “useful many” (in other words, the rest) as well.
In conclusion, Pareto analysis is a versatile, practical tool that helps us focus on where we can best start working first.
Efficient problem solving with Pareto
Get to know Pareto analysis with the video below, which explains the Pareto principle. Learn how to use the 80/20 rule to uncover the factors that have the biggest influence on a problem, so you can solve it more effectively.
From theory to practice
Learn to apply this in practice
Topics like Pareto Analysis are applied directly to an improvement project from your own organisation in the Green Belt training.
Next start dates
Lean Six Sigma Green Belt training →Not ready for a training yet?