A Value Stream Map (VSM) is a data-rich process map. It shows how a product or service flows through the process to the customer, how long each step takes and above all how long the work sits waiting. That makes it visible where the waste is.
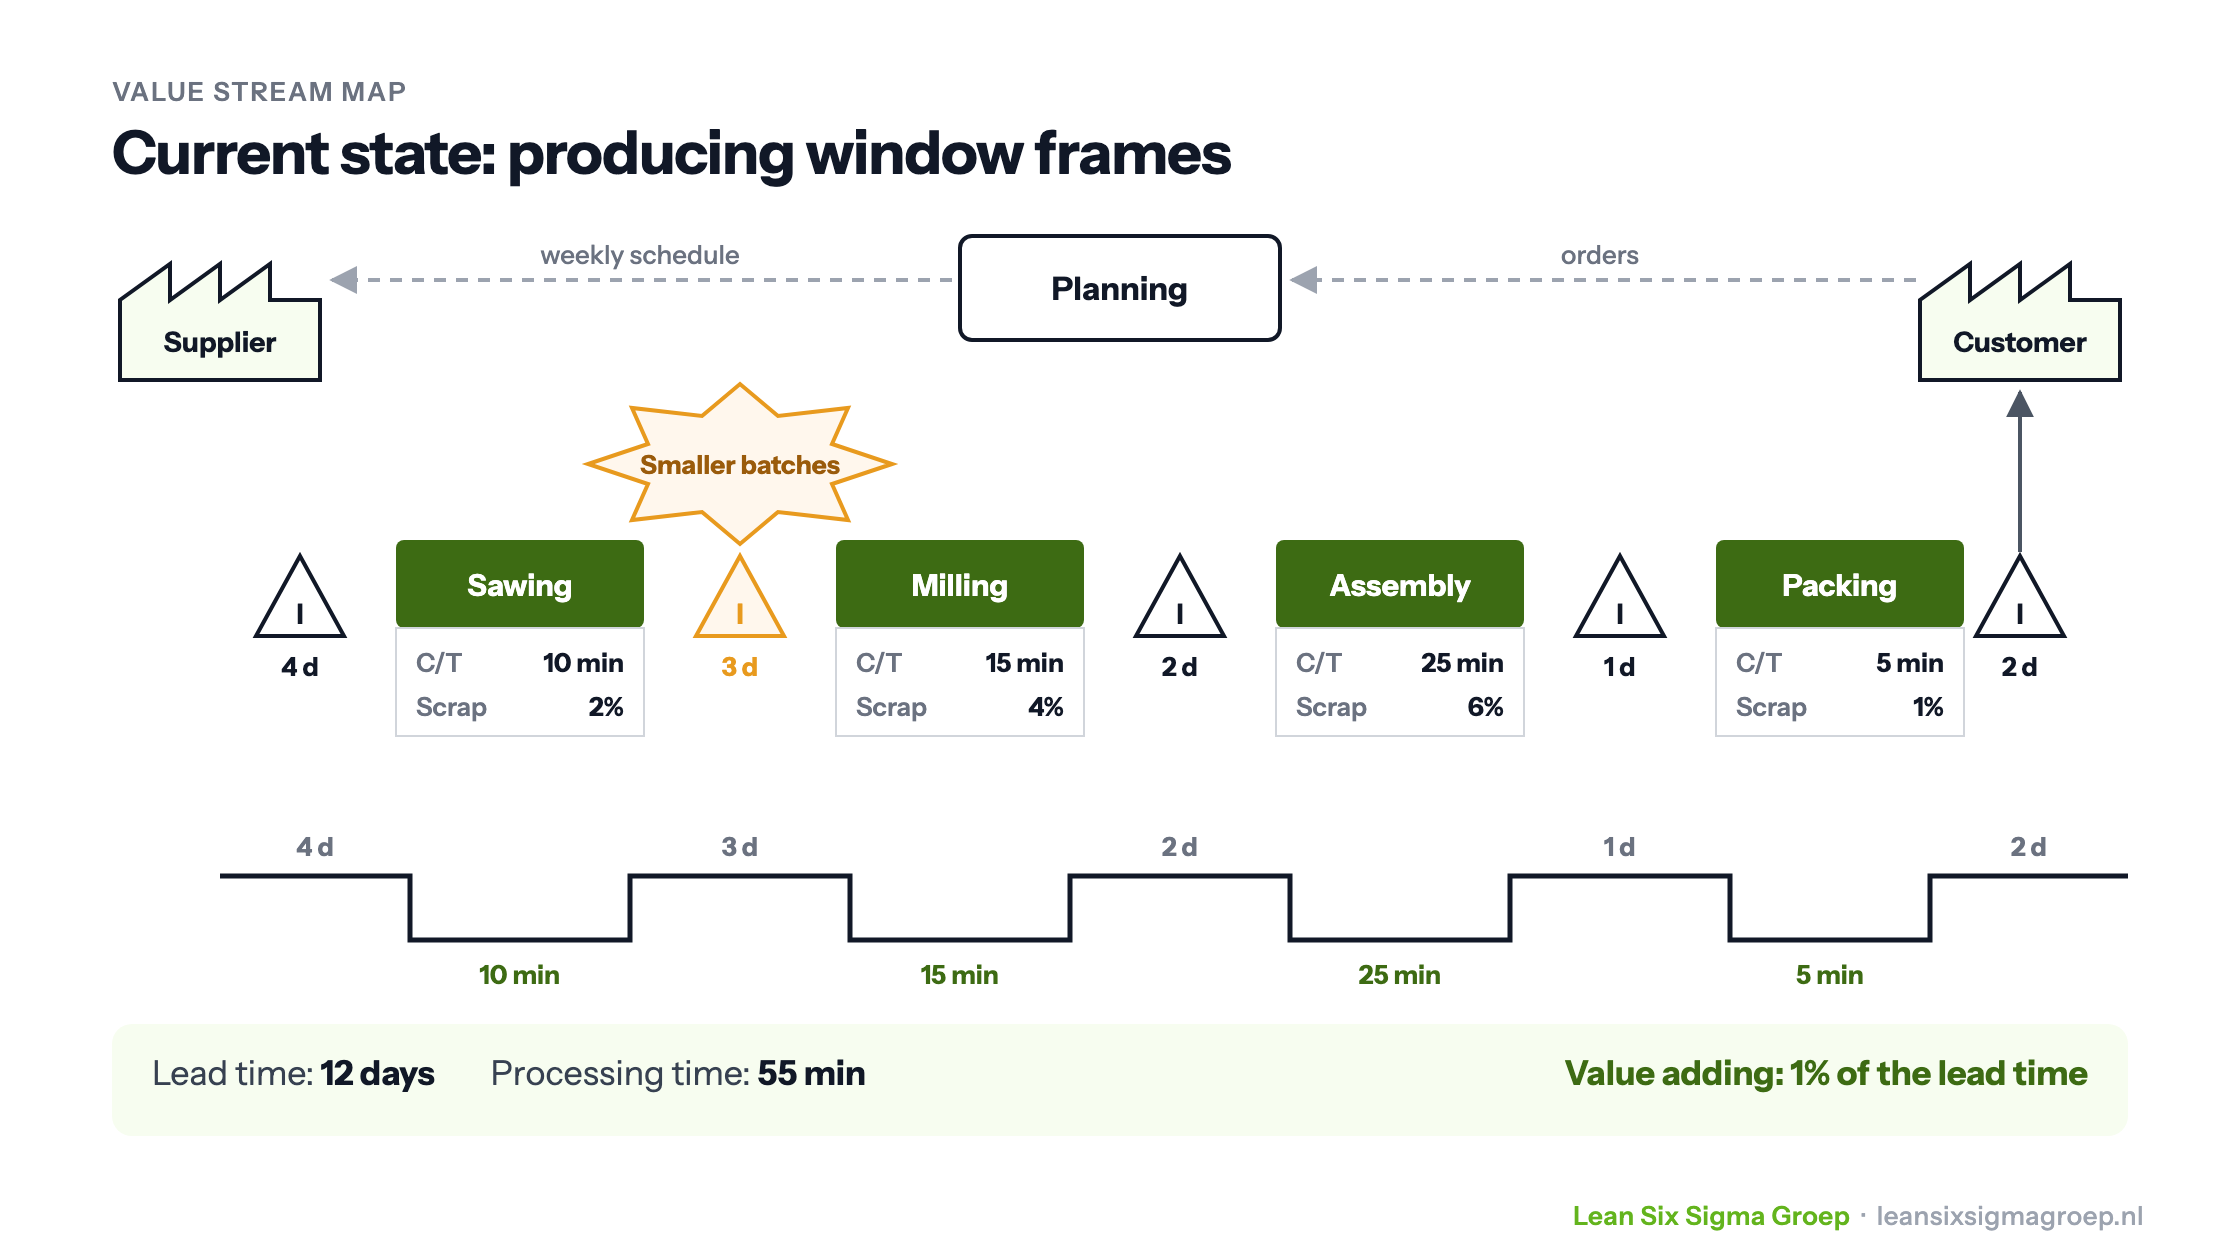
The image at the top of this article shows an example: producing window frames in four steps, with the stock between the steps (the triangles) and the timeline at the bottom. The processing steps take 55 minutes together, but a window frame is on its way for 12 working days. So only 1% of the lead time adds value. That ratio is very common, and it is exactly what a VSM shows.
Meaning
The name “value stream” can be misleading. A VSM contains all process steps, including the ones that later turn out not to add value.
Features of a VSM
- You start with the customer. The customer is at the top right, and you walk the process backwards, from the finished product to the supplier. Once drawn, the steps simply run from left to right.
- You make it with the people who work in the process. They know how it really works.
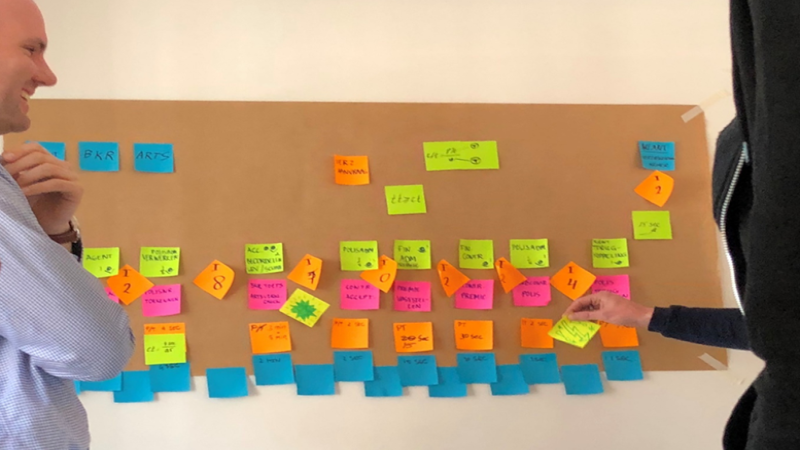
- You often make it on brown paper. All information goes on sticky notes, so you can easily adjust the process.
- It shows two flows: the material flow (the steps and the stock between them) and the information flow (how orders and planning drive the process).
How to create a VSM
First choose which process you want to look at: which process isn’t running well and needs to improve? Then build the VSM in a number of steps:
- Start with the customer. Who is the customer and what do they want? How many products, when and how?
- Name the main suppliers. How often do they deliver, what and how?
- Draw the process steps, starting with the last one. Keep asking: where did this step get the work from? Describe each step briefly.
- Collect the data for each step in a data box, for example processing time, cycle time (how often a piece is finished), changeover time and scrap rate.
- Map the stock and waiting time between the steps. How much work is waiting, and for how long?
- Draw the timeline at the bottom with waiting time and processing time, and add them up to the lead time.
You have now mapped the current situation, the current state: the route a product follows today, with the material and information flows and the sources of waste, such as stock and waiting time.
From current state to future state
The places with waste are where you can improve after a good analysis. You mark them with a kaizen burst, the orange star in the example. Then you draw the desired situation, the future state: a process in which the product flows through with as little waiting as possible.
This is one of the tools you learn to apply in the Green Belt training.
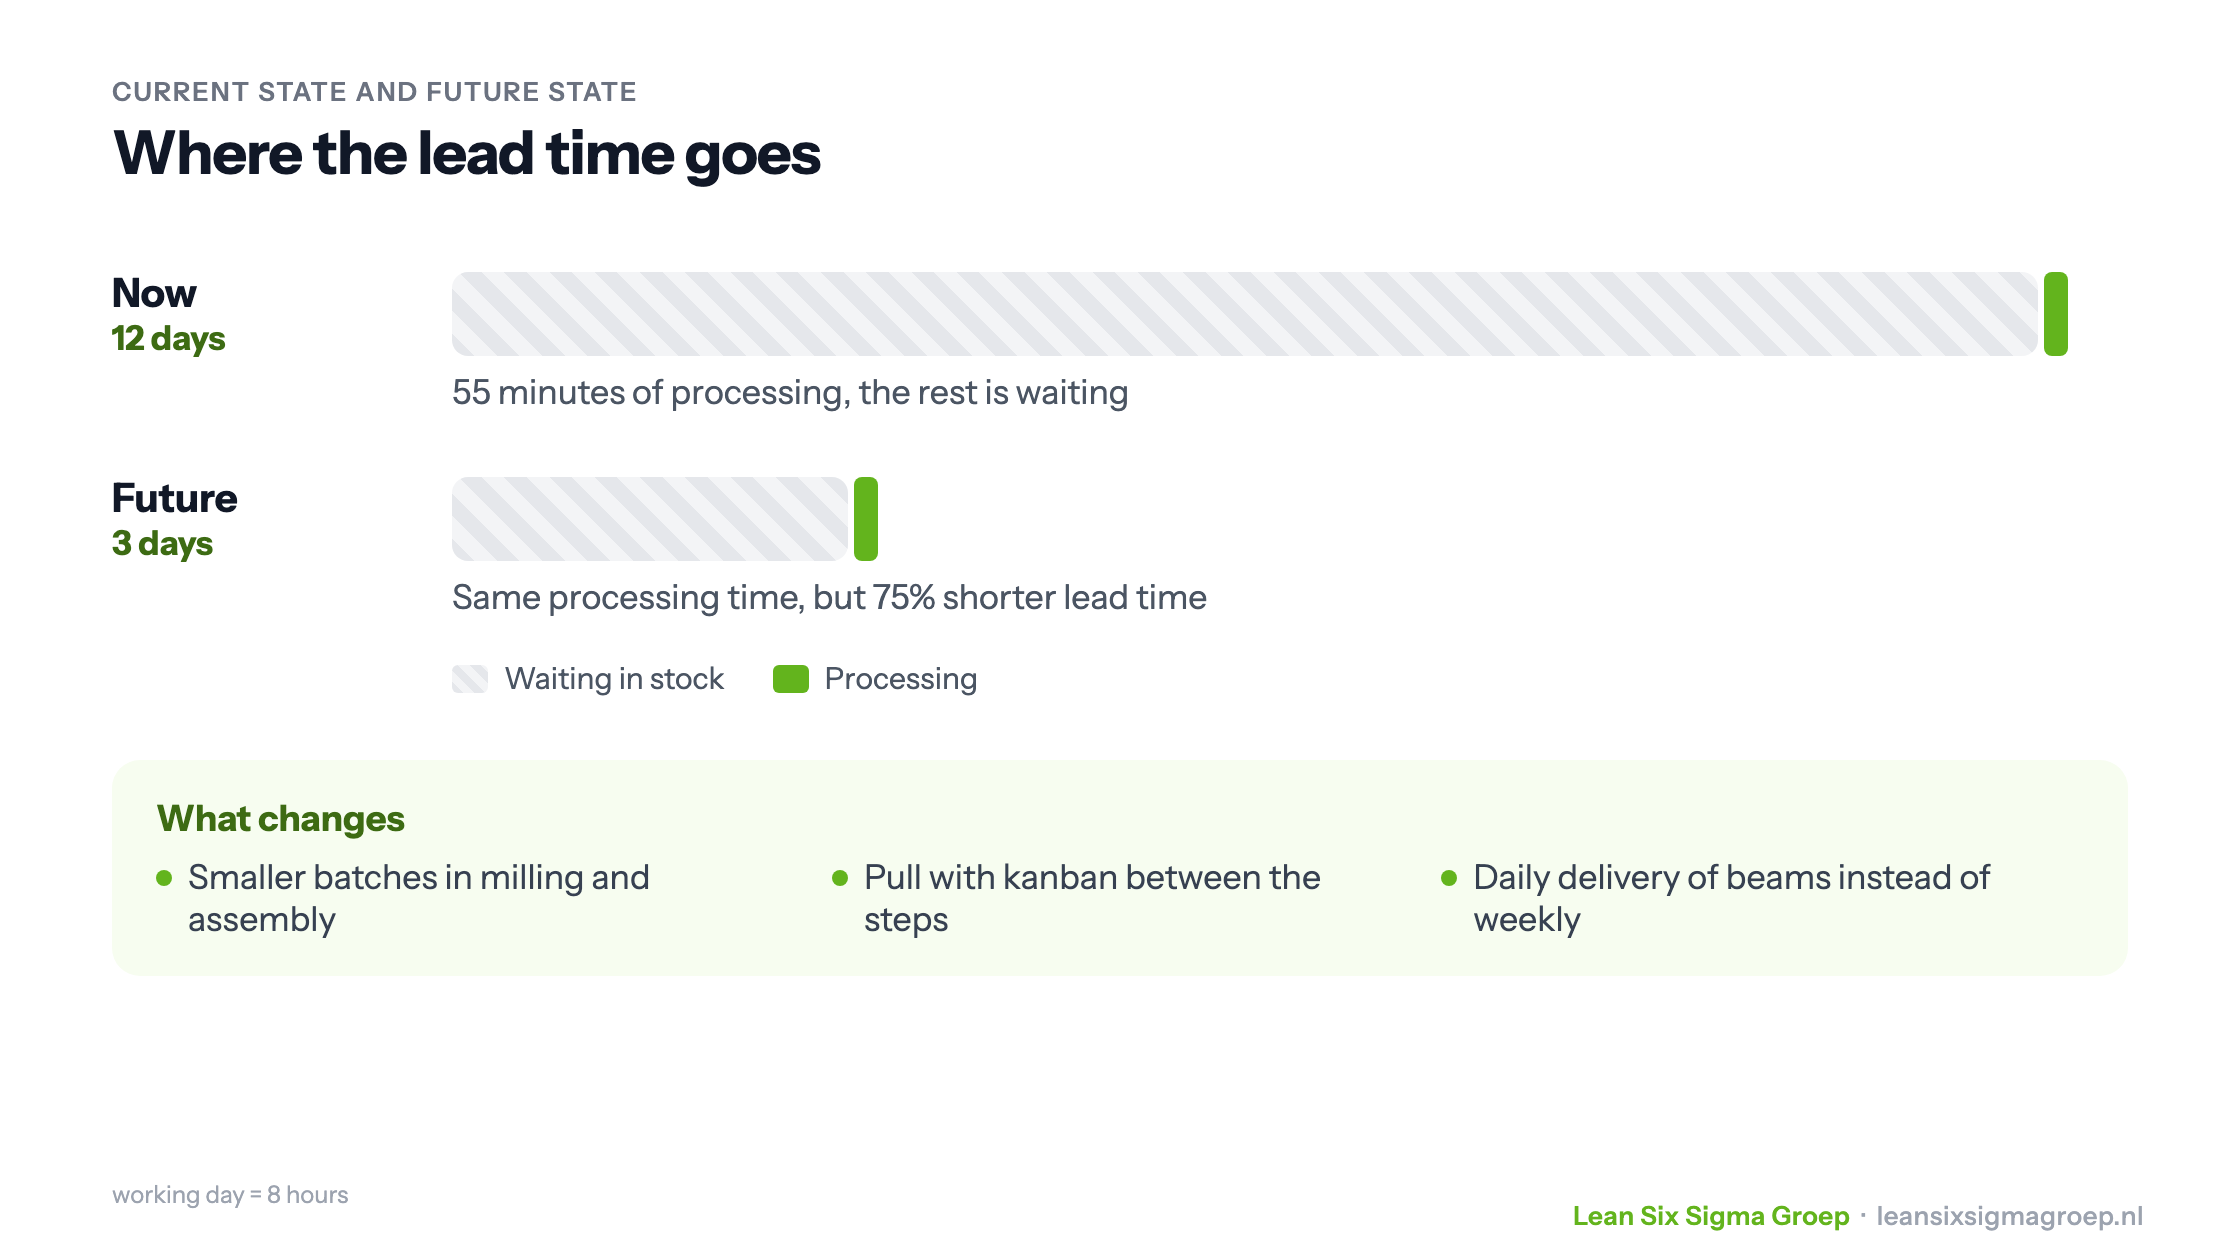
Finally you make an improvement plan to get from the current state to the future state, and carry it out step by step, for example with kaizen events.
Benefits of a Value Stream Map
- Everyone in the process has the same overview. The process has become a shared process, and together you can take the step towards improvement.
- You see not only the steps, but also the time between them. That is usually where the biggest gains are.
- You choose improvements that shorten the lead time of the whole process, instead of making one step faster while the work then sits waiting again.
If you only want to show the steps and roles, without times and stock, a swimlane or a flowchart is enough. You can also draw kaizen bursts with our free kaizen burst tool.
A VSM in practice
This is what a VSM looks like during a session: sticky notes on brown paper, together with the people from the process.