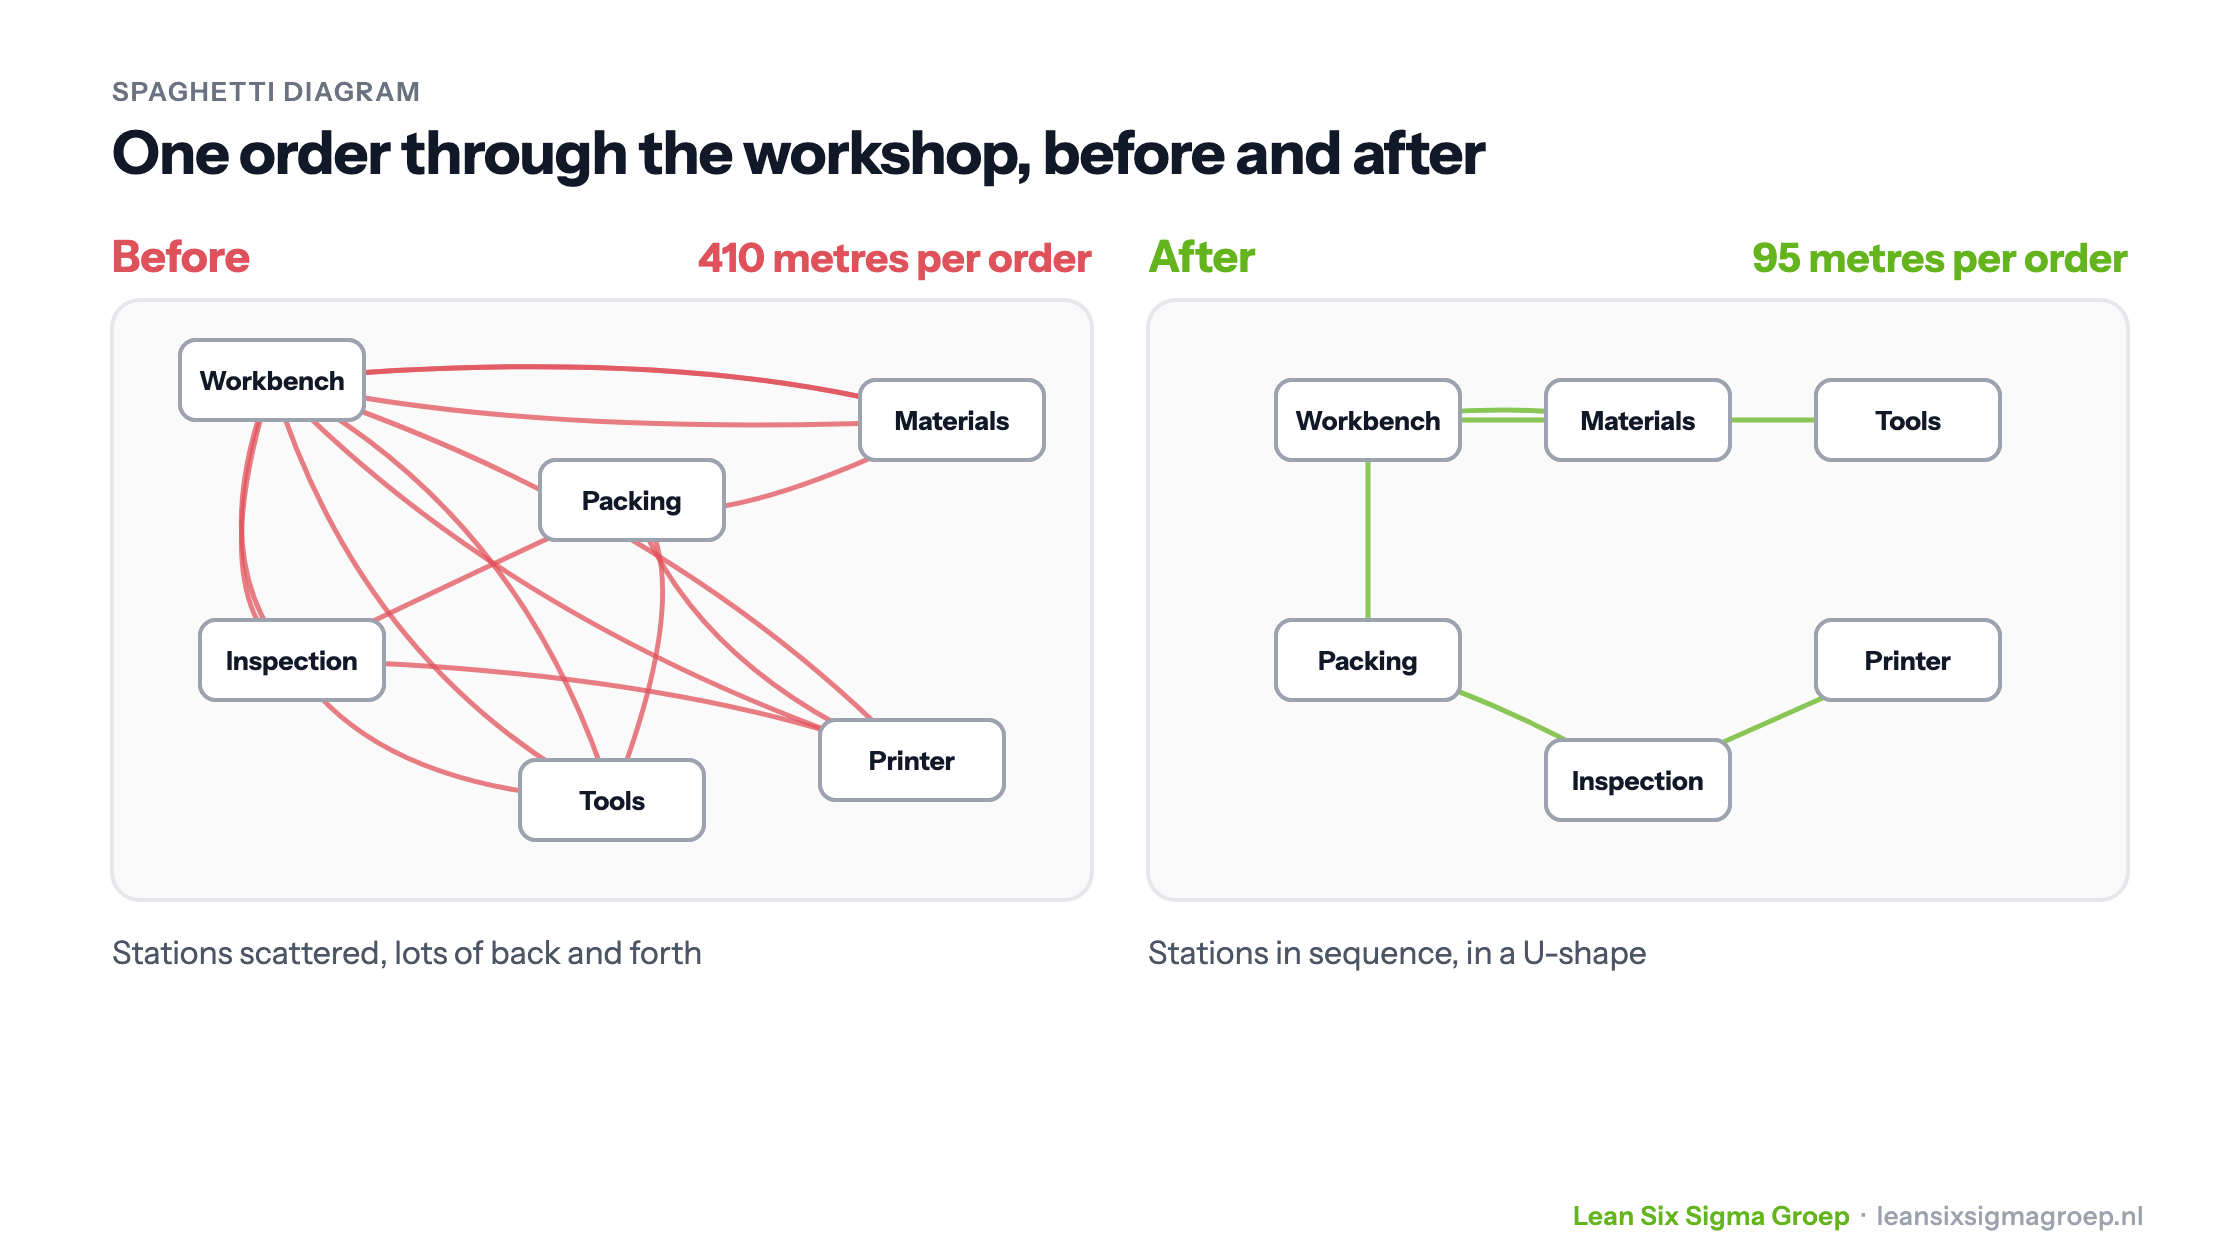
A spaghetti diagram is a drawing of the route a worker or product takes during the work. You draw every movement as a line on the floor plan. The more often a route is walked, the thicker and messier it gets, just like a plate of spaghetti. That shows at a glance how much walking and carrying is going on.
What do you use a spaghetti diagram for?
A spaghetti diagram makes two of the eight wastes visible: transport, moving products or materials, and motion, people walking, searching and reaching. You use it to:
- gain insight into how efficiently a workplace or department is laid out;
- reduce unnecessary walking and searching;
- make the workplace safer, with fewer crossing routes;
- decide where materials, tools and equipment are best placed.
The image at the top of this article shows an example. In the old situation, the stations in a workshop are scattered and a worker walks 410 metres back and forth for one order. Placing the stations in the order of the work, in a U-shape, leaves 95 metres.
The spaghetti diagram works wherever people walk or move things: in a factory, a warehouse, a laboratory, a kitchen, a hospital ward or an office.
How to make a spaghetti diagram
This is one of the tools you learn to apply in the Green Belt training.
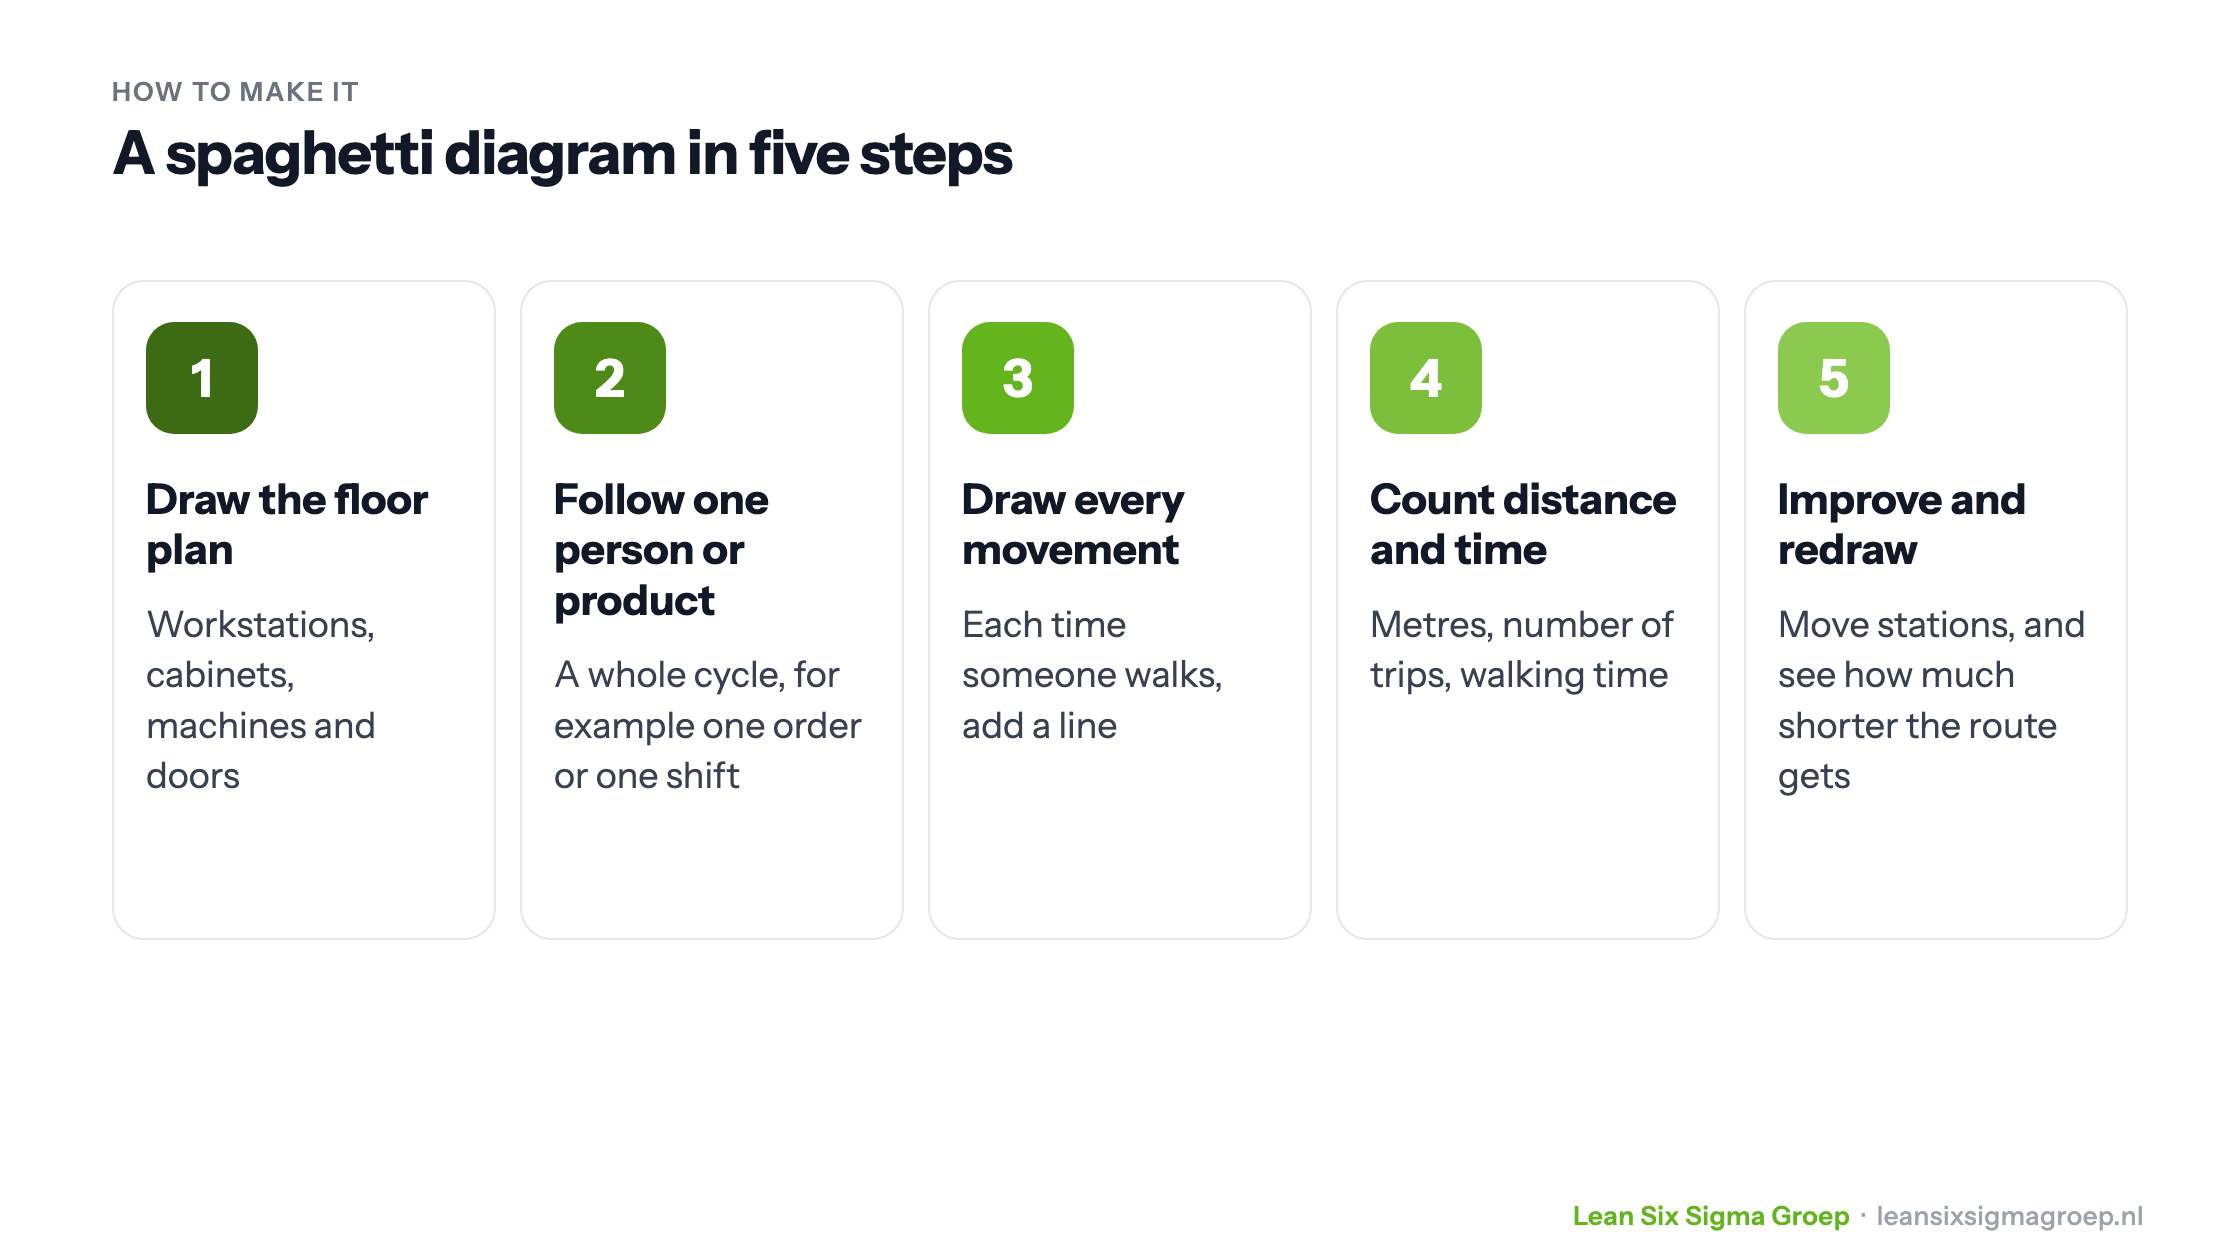
- Draw the floor plan of the workplace, with workstations, cabinets, machines and doors. It doesn’t have to be to scale, as long as the proportions are right.
- Follow one person or one product for a whole cycle, for example one order, one patient or one shift. Do this on the spot, on the shop floor, not from memory.
- Draw every movement as a line from one point to the next.
- Count distance and time: how many metres, how many trips back and forth, and how much time does the walking take?
- Improve and redraw. Discuss with the workers why the routes run this way, move stations or materials, and make a new diagram to see the effect.
Combine the spaghetti diagram with 5S to keep the workplace in order for good, and with a value stream map if you also want to see the waiting time between steps.
Conclusion
The spaghetti diagram is a simple but powerful way to make unnecessary walking and transport visible. By laying out the workplace more smartly, you shorten lead times and make work lighter and safer. Grab pen and paper, follow a shift, and see what you notice.